NHANES Data
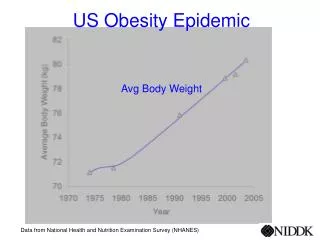
NHANES Data. National Health And Nutrition Examination Survey, 1999-2002 Indicated an estimated 65% of US adults are either overweight or obese This represents a prevalence that is 16% higher than estimates from NHANES, 1988-94 16% of children 9-16 yoa (~9 million) are overweight

NHANES Data
E N D
Presentation Transcript
NHANES Data • National Health And Nutrition Examination Survey, 1999-2002 • Indicated an estimated 65% of US adults are either overweight or obese • This represents a prevalence that is 16% higher than estimates from NHANES, 1988-94 • 16% of children 9-16 yoa (~9 million) are overweight • This is triple the amount from 1980 estimates
Obesity: Cause for Concern • Overweight & obesity results from a complex interaction between genes and the environment characterized by long-term energy imbalance • Major public health challenge as a major contributor to preventive death in the US
Obesity Figure 13.10
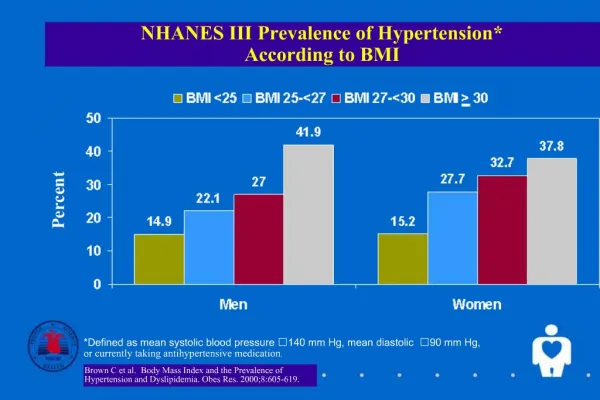
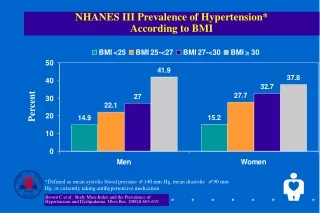
Disorders Related to Energy Intake • Overweight and obesity – epidemic in US linked to many chronic diseases: • Hypertension • Dyslipidemia - elevated total cholesterol, triglycerides, and LDL cholesterol, and decreased HDL cholesterol • Type 2 diabetes • Heart disease and stroke • Gallbladder disease
Disorders Related to Energy Intake • Overweight and Obesity – epidemic in US linked to many chronic diseases: • Osteoarthritis • Sleep apnea • Certain cancers: colon, breast, endometrial, and gallbladder • Gestational diabetes, premature fetal deaths, neural tube defects, and complications during labor and delivery • Depression
Why treat obesity? • Condition substantially raises risk of morbidity and mortality • Evidence from controlled trials indicates that weight loss reduces risk factors for disease • Estimated that at any given time 30-40% of population are trying to lose weight • An estimated $30-40 billion is spent on diet products and self-help books yearly
What is a Healthful Body Weight? • A healthful weight • Is appropriate for your age and physical development • Is maintained without constant dieting • Is based on family history of body shape and weight • Promotes good eating habits and allows for regular physical activity • Is acceptable to you
What is a Healthful Body Weight? • Underweight: having too little body fat to maintain health (BMI < 18.5 kg/m^2) • Overweight: having a moderate amount of excess body fat (BMI 25-29.9 kg/m^2)
What is a Healthful Body Weight? • Obese: having an excess of body fat that adversely affects health (BMI 30-39.9 kg/m^2) • Morbid obesity: body weight exceeding 100% of normal, creating a very high risk for serious health consequences (BMI > 40 kg/m^2)
Evaluating Body Weight • A person’s actual weight is not the only factor to consider • Determining if a person’s body weight is healthful should include: • Determining the Body Mass Index (BMI) • Measuring body composition • Assessing the pattern of fat distribution
Evaluating Body Weight • Body Mass Index • Expresses the ratio of a person’s weight to the square of their height • BMI = weight (kg) / height (m)2 • BMI = [weight (lbs) / height (inches)2] X 703 • BMI values below 18.5 or above 30 have increased health risks • Correlates with both morbidity & mortality
Evaluating Body Weight Figure 13.1
Evaluating Body Weight • Body composition • Measure of body fat and lean body mass • Can be measured by • Underwater weighing • Skinfold measurements • Bioelectric impedance analysis • Near infrared reactance • Dual-Energy X-Ray Absorptiometry • Bod Pod™
Evaluating Body Weight • Fat distribution pattern • Apple-shaped fat patterning – upper body • Increased risk for chronic diseases • Men tend to store fat in their abdominal region • Pear-shaped fat patterning – lower body • No significant increased risk for chronic diseases • Women tend to store fat in their lower body
Evaluating Body Weight • Fat distribution pattern: • Abdominal fat increases chronic disease risk • Waist-to-hip ratio • Men’s waist-to-hip ratio is higher than 0.90 • Women’s is higher than 0.80 • Waist circumference • Men above 40 in. (or 102 cm.) • Woman above 35 in. (or 88 cm.)
Evaluating Body Weight Table 13.3
Gaining or Losing Weight • Whether a person gains or loses weight depends on • Energy intake vs. energy expenditure • Genetic factors • Childhood weight • Behavioral factors • Social factors
Energy Balance • Energy balance • Occurs when energy intake = energy expenditure • Energy intake is kcal from food • Energy expenditure is energy expended at rest and during physical activity
Energy Intake • When total daily energy intake exceeds the amount of energy they expend, weight gain results • An excess intake of approximately 3,500 kcal will result in a gain of one pound • Without exercise, this gain will likely be fat
Energy Expenditure • Energy is expended to maintain basic body functions and to perform activities • Total 24-hour energy expenditure is composed of three components: • Basal metabolic rate (BMR) • Thermic effect of food (TEF) • Energy cost of physical activity
Energy Expenditure • Direct calorimetry is a method that measures the amount of heat the body releases • Indirect calorimetry estimates energy expenditure by measuring oxygen consumption and carbon dioxide production
Energy Expenditure • Basal Metabolic Rate (BMR) • Energy expended to maintain basal, or resting, functions of the body • The highest proportion of total energy expenditure (60-70%) • BMR increases with more lean body mass, during stress, and periods of growth • BMR decreases with age and during energy restriction
Energy Expenditure Table 13.4
Energy Expenditure • Thermic Effect of Food (TEF) • Energy expended to process food • About 5-10% of the energy content of a meal • Energy cost of physical activity • About 20-35% of someone’s total energy output each day
Genetic Factors • About 25% of one’s body fat is accounted for by genetic influences • Different ideas have been suggested to explain the impact of genetics on body fat • Thrifty Gene Theory • Set-point Theory
Genetic Factors • Thrifty gene theory • Proposes that a gene (or genes) causes people to be energetically thrifty • Proposes that people with this gene expend less energy than other people and therefore gain weight • A “thrifty gene” has not been identified
Genetic Factors • Set-point theory • Proposes that each person’s weight stays within a small range (set point) • The body compensates for changes in energy balance and keeps a person’s weight at their set point
Childhood Factors • Environmental factors in childhood can influence • Food choices • Activity levels • Later adult behaviors • Childhood overweight increases the risk of heart disease and premature death as an adult
Composition of the Diet • Theory states that overeating dietary fat promotes storage as adipose tissue • Overeating carbohydrate or protein will also lead to weight gain • Important to maintain a balanced diet combining fat, carbohydrate, and protein
Physiologic Factors • Hunger vs. appetite • Proteins affect the regulation of hunger and storage of body fat • Leptin acts to reduce food intake (feeling of satiety) • Ghrelin stimulates food intake • Peptide YY (PYY) decreases appetite • Uncoupling proteinsin brown adipose tissue increase energy expenditure
Physiologic Factors • Increase satiety (or decrease food intake) • Hormones – serotonin, cholecystokinin (CCK) • Increase in blood glucose levels after meal • Stomach expansion • Nutrient absorption from the small intestine • Decrease satiety (or increase food intake) • Hormones - beta-endorphins • Neuropeptide Y • Decreased blood glucose levels
Social Factors • Social factors influencing our diet include: • Family or cultural traditions • Holidays and celebrations • Easy access to high-fat foods • Less physically active lifestyles • Societal expectations of the “perfect” body
Achieve & Maintain Healthful Weight • Healthful weight change requires • Gradual change in energy intake • Regular and appropriate physical exercise • Application of behavior modification techniques
Set appropriate and realistic goals • Initial goal of weight loss therapy is to reduce body weight by ~10% from baseline in 6 months of therapy • Depending on the amount of overweight/obesity a decrease of 500-1000 kcal/day will lead to weight losses of ~1-2 pounds/week
Set appropriate and realistic goals • After 6 months, the rate of weight loss usually declines and weight plateaus (changing resting metabolic rates & difficulty adhering to lifestyle) • Experience reveals that lost weight usually will be regained unless a weight maintenance program consisting of diet therapy, physical activity, and behavior therapy is continued indefinitely
Weight Loss Diets • High-fat, low-carbohydrate, high-protein diets • Cause ketosis, which will decrease blood glucose and insulin levels and reduce appetite • Dr. Atkins’ Diet Revolution, Protein Power • Nutritionally inadequate, require supplements • Side effects: constipation, diarrhea, nausea, headaches, ketone breath, insomnia, fatigue
Weight Loss Diets • Moderate-fat, high-carbohydrate, moderate-protein diets • Balanced in nutrients: 20-30% calories from fat, 55-60% carbohydrate, 15-20% protein • Weight Watchers, Jenny Craig, DASH diet, and the USDA MyPyramid • Gradual weight loss (1-2 pounds per week) • Typical energy deficits 500-1000 kcal per day
Weight Loss Diets • Low-fat and very-low-fat diets • About 11-19% of total energy as fat, while very-low-fat-diets contain less than 10% • Dr. Dean Ornish’s Program for Reversing Heart Disease and The New Pritikin Program • Emphasize complex carbohydrates and fiber • Regular physical activity is a key component • Lower LDL cholesterol, triglyceride, glucose, insulin levels, and blood pressure
Achieve & Maintain Healthful Weight • Safe and effective weight loss • Follow recommended serving sizes • Reduce high-fat and high-energy food intake • Regular physical exercise: increase energy expenditure and BMR • Start slow & increase gradually • Long-term goal: accumulate at least 30 minutes of moderate intensity activity on most, and preferably all, days of the week