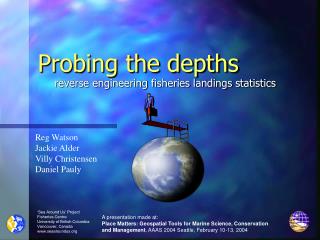
Reverse Engineering Fisheries Landings: Insights from the Sea Around Us Project
This presentation, made at the AAAS 2004 conference, explores the reverse engineering of fisheries landings statistics. It examines the global trends in fish landings, revealing a disturbing shift toward smaller and lower trophic level species over the decades. The research highlights significant reductions in landings, mean size, and trophic levels of catch, along with a growing reliance on marine resources, challenging the sustainability of fisheries. Recommendations for management and policy adjustments are discussed, emphasizing the importance of place-based strategies.

Reverse Engineering Fisheries Landings: Insights from the Sea Around Us Project
E N D
Presentation Transcript
Probing the depths Reg Watson Jackie Alder Villy Christensen Daniel Pauly reverse engineering fisheries landings statistics ‘Sea Around Us’ Project Fisheries Centre University of British Columbia Vancouver, Canada www.seaaroundus.org A presentation made at: Place Matters: Geospatial Tools for Marine Science, Conservation and Management, AAAS 2004 Seattle, February 10-13, 2004
Introduction • Why did we do it? • What did we do • Main findings • global reporting distortions • global trend towards smaller, lower trophic level landings • future scenarios differ by place
Methodology • Problems to overcome • what (aggregated groups) • who (reflagging) • how much (illegal, discards etc) • where (huge areas!)
Reporting Areas 48 x 106 km2
Area USA - 1985 - Pacific Jack Mackerel –FAO 77
Distribution USA - 1985 -Pacific Jack Mackerel– FAO 77
Area + Distribution USA - 1985 -Pacific Jack Mackerel – FAO 77
Access (EEZ) USA - 1985- Pacific Jack Mackerel – FAO 77
Distribution + Access USA - 1985 - Pacific Jack Mackerel– FAO 77
Area + Distribution + Access USA - 1985 - Pacific Jack Mackerel – FAO 77
Landing Allocated (zoom) ½°x½° spatial cells USA - 1985 - Pacific Jack Mackerel – FAO 77
Results • reductions in landings
Decade with Maximum Landings Decade 1950s 1960s 1970s 1980s 1990s Prepared by Adrian Kitchingman Conservation in Practice
Results • reductions in landings • reductions in mean size
Length Change (1950-2000) North Atlantic 90 length (cm) 70 Global coastal 50 1950 1960 1970 1980 1990 2000 Standard Length Change (cm) no data Decrease > 100 > 50 > 5 no change Increase > 5 > 50 > 100 Prepared by Adrian Kitchingman
Results • reductions in landings • reductions in mean size • reductions in trophic level
Results • reductions in landings • reductions in mean size • reductions in trophic level • fuel needed for fishing fleets
Global Fuel Use 2000 Fuel use litre km-2 > 1,500 < 1,500 < 1,000 < 500 < 400 < 300 < 200 < 100 < 50 < 10 85 M t landings / 47 M t fuel Collaboration with Peter Tyedmers, Dalhousie University
Results • reductions in landings • reductions in mean size • reductions in trophic level • fuel needed for fishing fleets • fishing vs marine mammals
Results • reductions in landings • reductions in mean size • reductions in trophic level • fuel needed for fishing fleets • fishing vs marine mammals • data for ecosystem models ->
Scenarios • Plausible, challenging and relevant stories about how the future might evolve NOT • forecasts, projections or predictions
Fisheries & Scenarios • Previous Studies • Pope 1989 • Cury & Cayré (2001) • Pauly (2000) • Current • Pauly et al. (2003) • Millennium Assessment (2004)
‘Order from Strength’ • Rich protect their borders and minimal investment in poorer countries • Rich try to maintain ecosystem services by local and national actions but global impacts are experienced • Overall ecosystems and services declining, some areas OK but vulnerable, others are in peril
‘Adapting Mosaics’ • Management disaggregated; • Increased awareness of the importance of resilience; • Local management and learning; • Sharing of lessons learned.
‘Technogarden’ • Improved efficiencies in food production and other selected services; • Potential to efficiently use and sustain ecosystem services; • Risk of surprises!
‘Global Orchestration’ • Economic and environmental policies • Trade barriers and subsidies phased out • Global initiatives are implemented • Human well being improved, environment???
Landings - Benguela Current 16 14 12 10 Landings (tonnes) 8 6 Techno 4 Global Mosaic 2 Strength 0 2000 2010 2020 2030 2040 2050 Year
Value - Central North Pacific 18 16 14 12 10 Landings value (USD/km2) 8 6 Techno 4 Global Mosaic Strength 2 0 2000 2010 2020 2030 2040 2050 Year
Diversity - Gulf of Thailand 7 6 5 Global 4 Mosaic Strength Landing diversity index Techno 3 2 1 0 2000 2010 2020 2030 2040 2050 Year
Conclusions • Reverse engineering works • Place matters • Policy matters • It is not too late
Acknowledgements The Sea Around Us project is a UBC Fisheries Centre partnership with the Pew Charitable Trusts of Philadelphia, USA Collaborators: Peter Tyedmers, Dalhousie University Adrian Kitchingman, Fred Valdez and other Sea Around Us Project and Fisheries Centre colleagues VISIT OUR WEB SITE: WWW.SEAAROUNDUS.ORG THANK YOU
Acknowledgements The Sea Around Us project is a UBC Fisheries Centre partnership with the Pew Charitable Trusts of Philadelphia, USA Collaborators: Peter Tyedmers, Dalhousie University Adrian Kitchingman, Fred Valdez and other Sea Around Us Project and Fisheries Centre colleagues VISIT OUR WEB SITE: WWW.SEAAROUNDUS.ORG THANK YOU
Trophic Level Change (1950-2000) Trophic Level Change no data Decrease >1 >.5 >.1 no change Increase >.1 >.5 >1 Prepared by Adrian Kitchingman Scientific American July 2003