
Uploaded by
cricket
8 SLIDES
708 VUES
80LIKES
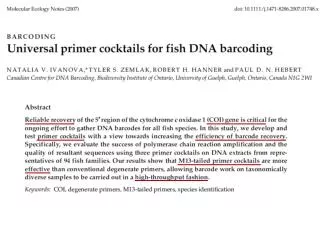
Evolutionary tree for fish species
DESCRIPTION
Sample isolation for SDS-PAGE. SDS and heat disrupt 2
Download

1 / 8
Télécharger la présentation 
Evolutionary tree for fish species
An Image/Link below is provided (as is) to download presentation
Download Policy: Content on the Website is provided to you AS IS for your information and personal use and may not be sold / licensed / shared on other websites without getting consent from its author.
Content is provided to you AS IS for your information and personal use only.
Download presentation by click this link.
While downloading, if for some reason you are not able to download a presentation, the publisher may have deleted the file from their server.
During download, if you can't get a presentation, the file might be deleted by the publisher.
E N D
Presentation Transcript
1. Evolutionary tree for fish species
2. Sample isolation for SDS-PAGE
3. SDS-PAGE gel
4. WEEK 1: Isolating the Protein
5. Identifying Similarities Between Species Using Protein Gel Electrophoresis
6. Week 2: Analyzing our gels
7. Equations for size MW of protein = # of aa x 110D/aa
Actin: 42000D = # of aa x 110D/aa
~382 aa
MW of gene (kD) = ((# of aa x 3 codons/aa) x 660D/base pair)/1000
~382 x 3 x 660/1000 = 756.3kD (size of actin gene)
8. Equations for commonality Percent commonality = (# proteins in common between 2 species)/(total # of proteins for both species) x 100%
Percent commonality = (12 similar bands)/(37 bands total) x 100%
~32%
9. Kaleidoscope standard


More Related