Optimizing Subjective Results
Optimizing Subjective Results. Julia C. O'Neill Karl R. Wursthorn Rohm and Haas Company ASA/ASQ Fall Technical Conference October 18, 2002. Outline. Problem: Topaz Appearance Solution Techniques: Factorial Design Paired Comparisons Multidimensional Scaling References and Software.

Optimizing Subjective Results
E N D
Presentation Transcript
Optimizing Subjective Results Julia C. O'NeillKarl R. Wursthorn Rohm and Haas Company ASA/ASQ Fall Technical Conference October 18, 2002
Outline • Problem: Topaz Appearance • Solution Techniques: • Factorial Design • Paired Comparisons • Multidimensional Scaling • References and Software
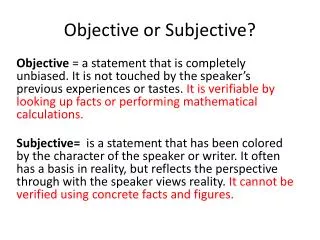
The Topaz Finish: Objective • To develop a formula which will consistently provide the customer the appearance they want; and investigate the effects of formulation and application variables on Topaz appearance. • To become 100% supplier of powder coatings to this customer.
Problem: Topaz Appearance • Does our coating “look right”? • What matters is what the customer sees. • The Topaz coating appearance depends on many variables. • Formulation • Application conditions • Measurable attributes do not give the whole picture for multi-color finishes. • Gloss and color are “averages”.
The Solution • Factorial experiments allow the estimation and comparison of many effects. • Paired comparisons simplify the task of judging appearance. • Multidimensional scaling reveals the underlying dimensions of appearance.
Experiment Design • Variables: • Grinding equipment (3 types) • Particle size (3 distributions) • Additive (A, B, or none) • Spray gun tip (conical or slot) • Powder charge (60 or 90 kV) • Gun feed (cup or fluid bed) • Initial screening design had 16 runs • 110 panels sprayed • Optimal selection of 20 panels
Appearance Data Collection • Discover, rather than impose, dimensions of appearance • Do not specify attributes • Trained, experienced “eyes” are critical
Paired Comparisons • When objects to be compared can be judged only subjectively. • When differences between objects are small. • When comparison of two objects at one time is simpler than comparing many objects. • When the comparison between 2 objects should not be influenced by other objects. • When we want to uncover “hidden structure” of objects.
Paired Comparisons vs. Ranking vs. Rating • Ranking is preferred when: • Several objects can easily be compared simultaneously. • Differences between objects are fairly apparent. • Rating is preferred when: • Several grades can be distinguished with consensus among judges. • Ratings can be treated like measurements.
Instructions to Evaluators • Cluster based on similarity: Looking at all 20 panels, form groups of any panels which are indistinguishable • Panels in same group have dissimilarity 0 • Select one panel to represent each group • Rate each pair of distinct panels 1 to 4: • 1 means hardly any difference • 4 means very different • Rate based on “appearance”, whatever that means to the judge.
Dissimilarity Data Collection • Number of pairs is: • For 20 objects, 190 pairs. • Similar to a Balanced Incomplete Block design with block size 2 • Modification of all possible pairs of panels • Sort first into indistinguishable groups • Can be optimized for order of presentation • Can be fractionated
Mapping Example of Multidimensional Scaling • Start with distances between objects (cities). • Given only the distances, produce the map.
Distances among Objects No meaning when i=j Same distance from i to j as from j to i.
Dissimilarities among Objects No meaning when i=j No effective difference for ij versus ji
Motivating Concept of MDS • Dissimilarities behave like distances. • ij should correspond to dij. • Configuration should place similar objects near each other.
Advantages of MDS • Uncover hidden structure of data • Reduce to a few dimensions • Compare objects at opposite ends • Examine physical configuration of objects
Common applications: • Psychologists • Perception of speech and musical tones • Perception of colors and faces • Anthropologists • Comparing different cultural groups • Marketing researchers • Consumer reactions to products
Multidimensional Scaling for Topaz • Dissimilarity is analogous to distance. • Given only the dissimilarities, produce the configuration. • If configuration is good, unlike objects will be far apart. • More complicated than distances: • Noise in the data • Number of dimensions is unknown
Types of MDS: d = f() • Metric • d = b • d = a + b • Nonmetric • ordinal relationship, increasing or decreasing • Choice of function has little effect on configuration
Computational Approach • Define an objective function (badness-of-fit). • Stress is sum of squared discrepancies divided by a scaling factor. • Specify f. • Find the best configuration X to minimize the objective function.
Determining Dimensionality • Useful • People can focus on only a few attributes • Difficult to interpret or display more than 3 • Rule of thumb • R (I-1)/4 • Statistical • range ofreasonabledimensions
Three-Way MDS • Can use average dissimilarities in two-way MDS. • ALSCAL/PROXSCAL in SAS, SPSS, make full use of information from multiple judges • For Topaz data, judges were very consistent, not much difference with 3-way MDS.
Interpretation • Examine the Configuration! • Dimensional Approach • Regress other variables on coordinates • Attends most to large distances • Neighborhood Approach • Shared characteristics in the same region • Focus is on small distances • Eclectic Approach • Use any means at your disposal to understand as much as possible about the configuration
Examining the Configuration Finer Glossy, Fine texture Darker, Less metallic Lighter, More metallic Coarser
Relating Effects to Dimensions Darker, Less metallic Lighter, More metallic
Relating Effects to Dimensions Finer Coarser
Topaz Results • Created a formulation the customer accepted. • Discovered that gun tip is critical to the appearance of this formula. • Identified variables to consider when trouble-shooting complaints.
Summary • Factorial experiments allow the estimation and comparison of many effects. • Paired comparisons simplify the task of judging appearance. • Multidimensional scaling reveals underlying dimensions of appearance.
References • DAVID, HERBERT A. (1988) “The Method of Paired Comparisons.” London: Charles Griffin & Company Limited. • KRUSKAL, JOSEPH B. and WISH, MYRON (1978) “Multidimensional Scaling.” Sage University Paper series on Quantitative Applications in the Social Sciences, 07-011. Newbury Park and London: Sage Pubns. • VENABLES, W. N. and RIPLEY, B. D. (1994) “Modern Applied Statistics with S-Plus.” New York: Springer.
Software • SPSS • SAS • S-Plus • MASS library from Venables & Ripley • MASS@stats.ox.ac.uk