Download
1 / 35
350 likes | 367 Vues
Learn to draw and write equations for parabolas, cubics, hyperbolas, circles, exponential, and logarithmic functions, as well as find intersections and solve problems.

E N D
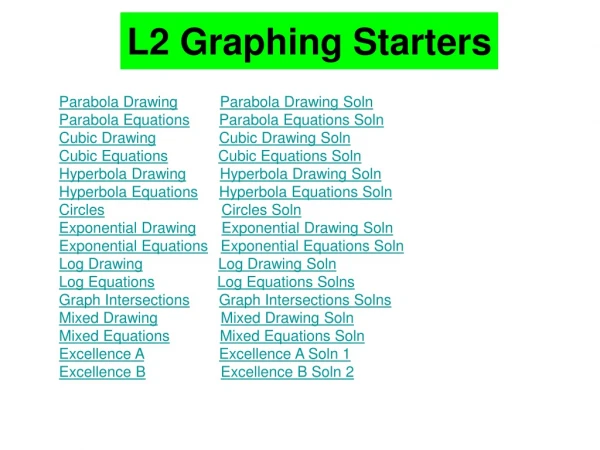
L2 Graphing Starters Parabola DrawingParabola Drawing Soln Parabola EquationsParabola Equations Soln Cubic DrawingCubic Drawing Soln Cubic EquationsCubic Equations Soln Hyperbola DrawingHyperbola Drawing Soln Hyperbola EquationsHyperbola Equations Soln CirclesCircles Soln Exponential DrawingExponential Drawing Soln Exponential EquationsExponential Equations Soln Log DrawingLog Drawing Soln Log EquationsLog Equations Solns Graph IntersectionsGraph Intersections Solns Mixed DrawingMixed Drawing Soln Mixed EquationsMixed Equations Soln Excellence AExcellence A Soln 1 Excellence BExcellence B Soln 2
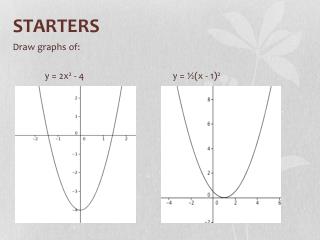
Draw these graphs 1st Slide Parabola Drawing
1st Slide Parabola Drawing Soln
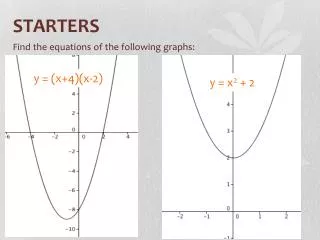
1st Slide Parabola Equations Write the equations for these graphs
1st Slide Parabola Equations Soln
Draw these graphs 1st Slide Cubic Drawing
Draw these graphs 1st Slide Cubic Drawing Soln
1st Slide Cubic Equations Write the equations for these graphs
1st Slide Cubic Equations Soln Write the equations for these graphs
Draw these graphs 1st Slide Hyperbola Drawing
1st Slide Hyperbola Drawing Soln
1st Slide Hyperbola Equations Write the equations for these graphs
1st Slide Hyperbola Equations Soln Write the equations for these graphs
Draw these graphs 1st Slide Circles Write the equations for these graphs
Draw these graphs 1st Slide Circles Soln
Draw these graphs 1st Slide Exponential Drawing
1st Slide Exponential Drawing Soln
1st Slide Exponential Equations Write the equations for these graphs
1st Slide Exponential Equations Soln Write the equations for these graphs
Draw these graphs 1st Slide Log Drawing
Draw these graphs 1st Slide Log Drawing Soln
1st Slide Log Equations Write the equations for these graphs
1st Slide Log Equations Solns Write the equations for these graphs
1st Slide Graph Intersections Find the intersection points between
1st Slide Graph Intersections Solns Find the intersection points between Coordinates are (1,0) &(-2,-3)
Draw these graphs 1st Slide Mixed Drawing
Draw these graphs 1st Slide Mixed Drawing Soln
1st Slide Mixed Equations Write the equations for these graphs
1st Slide Mixed Equations Soln Write the equations for these graphs
1st Slide Excellence A The temperature in a heated glasshouse can be modelled using a hyperbola. The form of the equation is given below. t = temp in centigrade & h = hours after the heating is turned on 1) Find an equation to model the temperature 2) Use your equation to find the temperature after 8 hr
1st Slide Excellence A Soln 1 The temperature in a heated glasshouse can be modelled using a hyperbola. The form of the equation is given below. t = temp in centigrade & h = hours after the heating is turned on 1) Find an equation to model the temperature
1st Slide Excellence A Soln 2 The temperature in a heated glasshouse can be modelled using a hyperbola. The form of the equation is given below. t = temp in centigrade & h = hours after the heating is turned on 1) Find an equation to model the temperature 2) Use your equation to find the temperature after 8 hr
1st Slide Excellence B A population of hamsters decreases according to an exponential model. In this form: P = population & m = months 1) Find an equation to model the population 2) Use your equation to find the population after 7 months
1st Slide Excellence B Soln 1 A population of hamsters decreases according to an exponential model. P = population & m = months 1) Find an equation to model the population
1st Slide Excellence B Soln 2 A population of hamsters decreases according to an exponential model. P = population & m = months 2) Use your equation to find the population after 7 months