Download
1 / 15
160 likes | 356 Vues
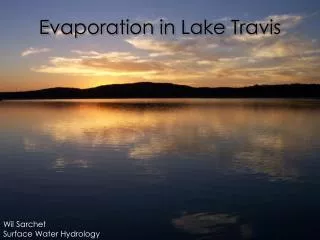
Evaporation in Lake Travis. Wil Sarchet Surface Water Hydrology. | Introduction |. Lake Travis. Northwest of Austin Formed in 1942 with the construction of the Mansfield Dam Average water volume of 1.13 million acre-feet Depths up to 190 feet deep A water source for Austin.

E N D
Evaporation in Lake Travis Wil Sarchet Surface Water Hydrology
|Introduction| Lake Travis • Northwest of Austin • Formed in 1942 with the construction of the Mansfield Dam • Average water volume of 1.13 million acre-feet • Depths up to 190 feet deep • A water source for Austin
|Objectives| • Examine the relationships between evaporation and precipitation, temperature, radiation, and time in Lake Travis • Evaluate the accuracy of the available datasources for evaporation in Lake Travis
|Data Collection| NCDC • Temperature • Austin-Mueller Airport TSRDB • Solar Radiation • University of Texas Campus US Army Corps of Engineers • Lake Evaporation • Lake Lavon, Collin County, Texas
|Data Collection| TWDB TWDB • Evaporation/Precipitation • One degree quadrangles (111.3 km quadrangles) Monthly Gross Lake Evaporation Rates • Computed by a GIS based program ThEvap • Based off of TWDB and National Weather Service collection sites • Pan coefficientsreflect both spatial and seasonal variation
|Data Collection| NARR North American Regional Reanalysis • Result of the National Centers for Environmental Prediction (NCEP) Eta Model • 32 km scale • Improved by the Regional Data Assimilation Systems (RDAS) • Surface Evaporation & Potential Evaporation Data Potential Evaporation • Potential water vapor capacity of the air • Amount of evaporation that would occur if a sufficient water source was available
|Results| 5 year and Long Term y = -0.0000x + 5.0411 TWDB
|Results| Diurnal Variation Winter Potential evaporation is an average of 2.9 times greater than evaporation with a max of 3.9 times greater Summer Potential evaporation is an average of 3.5 times greater than evaporation with a max of 5.5 times greater Comparison The maximum value of potential evaporation is 7.4 times greater in summer than in winter The maximum value of evaporation is 3.3 times greater in summer than in winter NARR
|Results| Temperature and Radiation Energy Balance Method Er = 0.0353Rn TWDB/NCDC/TSRDB
|Results| Precipitation TWDB
|Results| Lake Travis Evaporation Comparison “Evaporation estimates are notoriously uncertain” (Ruiz-Barradas and Nigam 2005)
|Results| Lake Lavon Evaporation Comparison Army Corps/NARR Potential Avg. = 0.885 St. Dev. = 0.127 Army Corps/TWDB Avg. = 1.148 St. Dev. = 0.222 NARR Potential Adjusted p value = 0.172
|Results| Lake Travis Evaporation Comparison
|Conclusions| • Significant seasonal and diurnal variation in Lake Travis evaporation data • Data supports the use of the Energy Balance Method as a valid way to predict evaporation • There is an inconsistency amongst data sources for Lake Travis evaporation