Download
1 / 37
370 likes | 375 Vues
Explore the impact of air pollution on global change and back, including ozone trends, anthropogenic emissions, and intercontinental transport.

E N D
TROPOSPHERIC CHEMISTRY:FROM AIR POLLUTION TO GLOBAL CHANGE AND BACK Daniel J. Jacob
NUMBER OF PEOPLE LIVING IN U.S. COUNTIES VIOLATING THE EPA AIR QUALITY STANDARDS, 1999 EPA [2001] 124 ppbv 84 ppbv
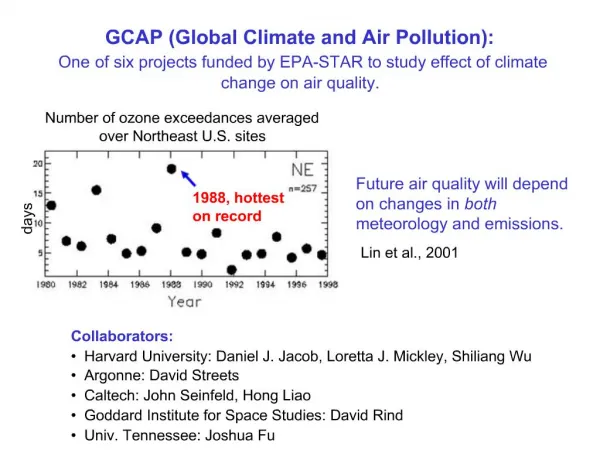
MEAN NUMBER OF SUMMER DAYS (1980-1998) EXCEEDING THE U.S. OZONE AIR QUALITY STANDARD (84 ppbv, 8-hour average) EPA/AIRS data [Lin et al., 2001]
TREND IN THE # SUMMER DAYS EXCEEDING 84 ppbv OZONE (8-hour average) Lin et al. [2001]
Stratospheric ozone TROPOSPHERIC OZONE AND RADICAL CHEMISTRY Tropopause (8-18 km) Complex non-linear chemistry! (we won’t touch it) ? Lightning ? hn hn, H2O Nitrogen oxides (NOx) CO, Hydrocarbons ? Ozone (O3) Hydroxyl (OH) The Pacman of the atmosphere! physics chemistry biology Fires Biosphere Human activity Ocean
GLOBAL RADIATIVE FORCING OF CLIMATE, 1750-present IPCC [2001]
Historical records imply a large anthropogenic contribution to the present-day ozone backgroundat northern midlatitudes Ozone trend from European mountain observations, 1870-1990 [Marenco et al.,1994] Preindustrial ozone models }
1750-2000 radiative forcing from tropospheric ozoneis less well constrained than implied by IPCC 2001 report Global simulation of late 19th century ozone observationswith the GISS GCM Standard model: DF = 0.44 W m-2 “Adjusted” model (lightning and soil NOx decreased, biogenic hydrocarbons increased): DF = 0.80 W m-2 [Mickley et al., 2001]
1980-1984 1994-1998 1980-1984 1994-1998 SURFACE OZONE IN U.S. INCLUDES A 20-40 ppbv BACKGROUND THAT HAS INCREASED BY ~3 ppbv OVER THE PAST 20 YEARS 8-h daily maximum ozone probability distribution at rural U.S. sites [Lin et al., 2000]
THIS OZONE BACKGROUND IS A SIZABLE INCREMENT TOWARDS VIOLATION OF U.S. AIR QUALITY STANDARDS(even more so in Europe!) Europe (8-h avg.) Europe (seasonal) U.S. (8-h avg.) U.S. (1-h avg.) 0 20 40 60 80 100 120 ppbv preindustrial present background
Growth of Asian emissions over the next decades will increase role of background for ozone air quality in U.S. Anthropogenic NOx emissions [IPCC, 2001] 2000 “Optimistic” IPCC scenario: OECD, U.S. m20%, Asia k 50% 2020 109 atoms N cm-2 s-1
Modeled increase in mean U.S. surface ozone (ppbv) from tripling of Asian emissions (1985 to 2015)with other emissions held constant Enough to offset the benefits of 25% reductions in domestic emissions! Jacob et al. [1999]
OZONE BACKGROUND IS DEPLETED DURING REGIONAL POLLUTION EPISODES(due to stagnation, ozone deposition and chem. loss) Observed (J.W. Munger) model (GEOS-CHEM) model background O3 vs. (NOy-NOx) At Harvard Forest, Massachusetts Background (clean conditions) Background (pollution episodes) Fiore et al. [2001] Pollution coordinate
RANGE OF ASIAN/EUROPEAN POLLUTION SURFACE OZONE ENHANCEMENTS OVER THE U.S. IN SUMMERdetermined from a simulation with these emissions shut offensemble of model results for the U.S., summer 1995 Subsidence of Asian pollution + local production Max enhancements (up to 14 ppbv) occur under moderately polluted conditions (50-70 ppbv ozone) stagnation tropical air MAJOR CONCERN IF OZONE STANDARD WERE TO DECREASE TO 40 or 60 PPBV Fiore et al. [2001]
CONCENTRATIONS AND FLUXES OF NORTH AMERICAN OZONE IN SURFACE AIR, GEOS-CHEM MODEL (1997) L APRIL H L JULY H Li et al. [2001]
ORIGIN OF SURFACE OZONE AT BERMUDA IN SPRING (S. Oltmans) Production over U.S. is the dominant source; stratosphere contributes less than 5 ppbv Li et al. [2001]
EFFECT OF NORTH AMERICAN SOURCESON VIOLATION OF EUROPEAN AIR QUALITY STANDARD (55 ppbv, 8-h average) GEOS-CHEM model results, summer 1997 Number of violation days (out of 92) # of violation days that would not have been in absence of N.American emissions Li et al. [2001]
Observed [Symmonds] OZONE DATA AT MACE HEAD, IRELAND Model vs. observed stats, 1993-1997 Time series, Mar-Aug 1997 GEOS-CHEM model N.America pollution events in model Li et al. [2001]
FORECASTING TRANSATLANTIC TRANSPORT OF NORTH AMERICAN POLLUTION TO EUROPE FROM THENORTH ATLANTIC OSCILLATION (NAO) INDEX NAO index = normalized surface P anomaly between Iceland and Azores NAO Index North American ozone pollution enhancement At Mace Head, Ireland (GEOS-CHEM model) r = 0.57 Li et al. [2001]
SURFACE OZONE ENHANCEMENTS CAUSED BYANTHROPOGENIC EMISSIONS FROM DIFFERENT CONTINENTS GEOS-CHEM model, July 1997 North America Europe Asia Li et al. [2001]
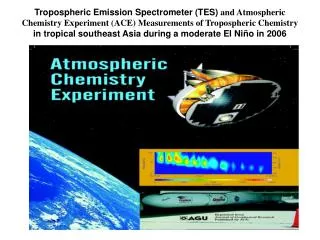
QUANTIFYING INTERCONTINENTAL TRANSPORTTHROUGH INTEGRATION OF OBSERVATIONS AND MODELS SATELLITE OBSERVATIONS Global and continuous but few species, low resolution Source/sink inventories 3-D CHEMICAL TRACER MODELS SURFACE OBSERVATIONS high resolution but spatially limited Assimilated meteorological data AIRCRAFT OBSERVATIONS High resolution, targeted flights provide critical snapshots for model testing Chemical and aerosol processes INTERCONTINENTAL TRANSPORT: CONCENTRATIONS AND FLUXES
TRAnsport and Chemical Evolution over the Pacific (TRACE-P)A two-aircraft NASA mission over the western Pacific in March-April 2001to quantify Asian chemical outflow to the Pacific and its relationship to sources: • long-lived greemhouse gases • ozone and precursors • aerosols and precursors
CENTRAL IDEA BEHIND TRACE-P:DEVELOP AN OBSERVATIONAL STRATEGY FOR “TOP-DOWN” QUANTIFICATION OF SOURCES Latest China report to Energy Information Administrationclaims a decrease of CO2 emissions after 1997. Can we test such “bottom-up”emission estimates using atmospheric observations?
Satellite data in near-real time: MOPITT TOMS SEAWIFS AVHRR LIS TRACE-P EXECUTION Stratospheric intrusions FLIGHT PLANNING Long-range transport from Europe, N. America, Africa 3D chemical model forecasts: - ECHAM - GEOS-CHEM - Iowa/Kyushu - Meso-NH -LaRC/U. Wisconsin ASIAN OUTFLOW Boundary layer chemical/aerosol processing DC-8 P-3 PACIFIC • Emissions • Fossil fuel • Biomass burning • Biosphere, dust ASIA PACIFIC
CARBON MONOXIDE CONCENTRATIONS IN TRACE-P High concentrations from fossil fuel combusion, biofuels, and biomass burning Biomass fires
C2Cl4 CONCENTRATIONS MEASURED IN TRACE-P C2Cl4(dry cleaning) is an anthropogenic pollution tracer Symbol size ->1/altitude Don Blake, UCI
CORRELATIONS BETWEEN SPECIES (here CO2:CO)OFFERED QUANTITATIVE INFORMATION ON SOURCES IN TRACE-P CO from G.W. Sachse CO2 from M.A. Avery
PRELIMINARY GLOBAL (GEOS-CHEM) 3-D MODEL ANALYSIS OF TRACE-P OBSERVATIONS Mat Evans, Harvard
ATMOSPHERIC COLUMNS OF NO2 AND FORMALDEHYDE (HCHO) MEASURED FROM GOMEBY SOLAR BACKSCATTERALLOW MAPPING OF NOx AND HYDROCARBON EMISSIONS GOME Tropospheric NO2 column ~ ENOx Tropospheric HCHO column ~ ENMHC ~ 2 km hn (420 nm) BOUNDARY LAYER hn (340 nm) NO2 NO HCHO CO OH hours O3, RO2 hours NMHC 1 day HNO3 Emission Deposition Emission NITROGEN OXIDES (NOx) NON-METHANE HYDROCARBONS
GOME SPECTRUM (423-451 nm) SLANT NO2 COLUMN TROPOSPHERIC SLANT NO2 COLUMN TROPOSPHERIC NO2 COLUMN IMPROVED RETRIEVAL OF TROPOSPHERIC NO2 FROM GOME (errors e in 1015 molecules cm-2) Fit spectrum e1 = 1.2 • Use Central Pacific GOME data with: • HALOE to test strat zonal invariance • PEM-Tropics, GEOS-CHEM 3-D model to treat tropospheric residual Remove stratospheric contribution, diffuser plate artifact e2 = 0.5 • Use radiative transfer model with: • local vertical shape factors from GEOS-CHEM • local cloud information from CRAG Apply AMF to convert slant column to vertical column e1 = 0.3-2.1 Martin et al. [2001]
CAN WE USE GOME TO ESTIMATE NOx EMISSIONS?TEST IN U.S. WHERE GOOD A PRIORI EXISTS Comparison of GOME retrieval (July 1996) to GEOS-CHEM model fields using EPA emission inventory for NOx GOME GEOS-CHEM (EPA emissions) BIAS = +3% R = 0.79 Martin et al. [2001]
GOME RETRIEVAL OF TROPOSPHERIC NO2vs. GEOS-CHEM SIMULATION (July 1996) Martin et al. [2001] GEIA emissions scaled to 1996
FORMALDEHYDE COLUMNS FROM GOME:July 1996 means Palmer et al. [2001a] BIOGENIC ISOPRENE IS THE MAIN SOURCE OF HCHO IN U.S. IN SUMMER
GOME DETECTS THE ISOPRENE “VOLCANO” IN THE OZARKS Palmer et al. [2001b]
DEPENDENCE OF GOME HCHO COLUMNSOVER THE OZARKS ON SURFACE AIR TEMPERATURE Temperature dependence of isoprene emission (GEIA) Palmer et al. [2001b]
MAPPING OF ISOPRENE EMISSIONS FOR JULY 1996 BY SCALING OF GOME FORMALDEHYDE COLUMNS [Palmer et al., 2001b] GOME COMPARE TO… GEIA (IGAC inventory) BEIS2 (official EPA inventory)