Download
1 / 59
590 likes | 732 Vues
http://www.leos.le.ac.uk/home/. Observations of tropospheric chemistry from space II. J.J. Remedios EOS-SRC, Physics and Astronomy, University of Leicester, U.K. j.j.remedios@le.ac.uk. GOME/SCIAMACHY/OMI/GOME-2. EXAMPLE: SCIAMACHY=The Sc anning I maging A bsorption

E N D
http://www.leos.le.ac.uk/home/ Observations of tropospheric chemistry from space II J.J. Remedios EOS-SRC, Physics and Astronomy, University of Leicester, U.K. j.j.remedios@le.ac.uk Dr. J.J. Remedios, ERCA Space 3
GOME/SCIAMACHY/OMI/GOME-2 EXAMPLE: SCIAMACHY=The Scanning Imaging Absorption Spectrometer for Atmospheric Chartography. • Grating spectrometer • Measures solar backscattered radiation in the U/V • Spectral coverage: 237 to 2380 nm at a spectral resolution of 0.2-1.5 nm. • Standard mode=nadir • Also offers limb mode for combined viewing with separation of 7 mins between view of same area. • The chief target gases are O3, NO2, SO2, HCHO, H2O, CO2, CO and CH4 Dr. J.J. Remedios, ERCA Space 3
SCIAMACHY instrument on ENVISAT I Dr. J.J. Remedios, ERCA Space 3
SCIAMACHY instrument on ENVISAT[NADIR MODE] Dr. J.J. Remedios, ERCA Space 3
SCIAMACHY instrument on ENVISAT[SIMILAR BUT MORE LIMITED SPECTRAL RANGES FOR GOME/OMI Dr. J.J. Remedios, ERCA Space 3
NO2 Pollution Image Courtesy Andreas Richter, IUP Bremen Dr. J.J. Remedios, ERCA Space 3
OMI • The Ozone Monitoring Instrument (OMI) was launched onboard the NASA EOS Aura satellite in July 2004. • OMI is a Nadir viewing spectrometer that measures in the spectral range between 270 and 500 nm. • Has a spectral resolution of 0.52 and 0.45 nm in the UV-1 and UV-2 channels and 0.63 nm in the visible channel. • OMI has a large swath width of 2600 km, to obtain this viewing swath the viewing angle is 114° • In the normal operation mode, the OMI pixel size is 13 x 24 km2 making it suitable for comparisons with measurements on an urban scale. Dr. J.J. Remedios, ERCA Space 3
2006 heat wave: UK 15-18 July 2006 Dr. J.J. Remedios, ERCA Space 3
2006 heat wave: UK 15-18 July 2006 Dr. J.J. Remedios, ERCA Space 3
Leicester pollution monitoring: NO2 Satellites In situ L. Kramer et al., accepted JGR 2008 Ground based remote sensing: CMAX-DOAS Dr. J.J. Remedios, ERCA Space 3
Leicester pollution monitoring of NO2: Seasonal cycle OMI Trop VCD vs field-of-view weighted in situ VCD = Vertical column density Leicester in situ sensors Dr. J.J. Remedios, ERCA Space 3
Leicester pollution monitoring of NO2: Weekly cycle Rural in situ Gp 1 in situ OMI VCD FOV-WEIGHTED IN SITU Dr. J.J. Remedios, ERCA Space 3
SCIAMACHY HCHO AND GLYOXAL Dr. J.J. Remedios, ERCA Space 3
Biogenic Emissions (C1) Formaldehyde is a break-down product of isoprene which is produced by vegetation. Isoprene production is strongly temperature dependent. Dr. J.J. Remedios, ERCA Space 3
Stochastic Events (C1) Dr. J.J. Remedios, ERCA Space 3
Role of halogens in the troposphere (C1) Dr. J.J. Remedios, ERCA Space 3
http://www.leos.le.ac.uk/home/ Observations of Carbon Monoxide from the MOPITT instrument J.J. Remedios, Nigel Richards, Robert Parker and Manasvi Panchal EOS-SRC, Physics and Astronomy, University of Leicester, U.K. Dr. J.J. Remedios, ERCA Space 3
Carbon Monoxide Why carbon monoxide (CO): • CO is a marker of large-scale influences of pollution on regional and global scales • It is strongly enhanced in both urban pollution and biomass burning. • It traces regional and inter-continental transport or export/import of such air (lifetime of a few months) • it marks emission “hot spots” • Its concentration is related to the oxidising capacity of the troposphere (through OH) and hence it provides a marker of “local” chemical environment and its state • hemispheric differences in CO indicate differing source strengths and differing chemical lifetimes. • long term trends in CO indicate changes in OH and hence the lifetimes of greenhouse gases and pollutants. • It acts as a reference source for incomplete combustion so that many emission factors of other gases are calculated with respect to CO. • Satellite measurements of CO are available for a long time period of 6 years (MOPITT and other sensors) and illustrate the use of such data in the above applications Dr. J.J. Remedios, ERCA Space 3
MOPITT • The Measurements of Pollution in the Troposphere (MOPITT) experiment is onboard the EOS-TERRA satellite • EOS-TERRA was launched on Dec. 18th, 1999 and is still active. • MOPITT observes infra-red emission at 4.6 mm using gas-correlation spectroscopy (length and pressure modulated radiometry). • Nadir measurements • For each measurement, both total columns and vertical “profiles” are determined and distributed • The horizontal resolution is 22 km, swath width of 640 km. The vertical “resolution” of the retrieved profiles is closer to 6-8 km. Dr. J.J. Remedios, ERCA Space 3
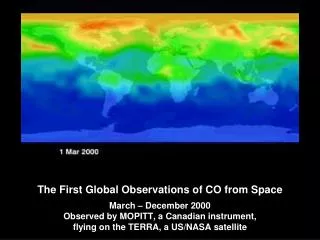
Measurements of CO from MOPITT: July 2001 Monthly mean CO observed from daytime retrievals of CO (“surface” retrieved level) – figure from N. Richards, PhD thesis, Leicester, 2004. Using diagnostics, we can show that there really are enhanced ‘surface’ CO concentrations in regions of biomass burning (Africa) and industrial activity (Houston, South East Asia and China) Dr. J.J. Remedios, ERCA Space 3
“SURFACE” POLLUTION MOPITT SEVEN DAY COMPOSITE (“700 mb” level) ABOVE HOUSTON, U.S.A. Sept. 6-15 2002 Dr. J.J. Remedios, ERCA Space 3
WILDFIRES • MOPITT data can also be used for the monitoring of intense pollution events such as wildfires. • MOPITT daytime data for August 2000 (monthly mean diagnostic field) indicates high ‘surface’ level CO associated with forest fires in Montana. Dr. J.J. Remedios, ERCA Space 3
Fires MODIS Fire Map: 9th - 19th July, 2004 Dr. J.J. Remedios, ERCA Space 3
Deducing horizontal and vertical information Horizontal Spatial information: trade-off is “cloud-free coverage” vs spatial resolution vs temporal resolution vs time Satellite data utility depends on application Vertical Conventional wisdom is satellite is measuring vertical column without good vertical resolution. For infra-red, “conventional” = no sensitivity to surface but not true! Nighttime MOPITT = sensitive to mid-troposphere Daytime MOPITT has some surface sensitivity to lower troposphere when T surface > T atmosphere. Hence day – night is more sensitive to surface/lower troposphere Dr. J.J. Remedios, ERCA Space 3
MOPITT data, single day, 0.5 deg. resolution Single day of “surface” level MOPITT data: 15th July 2004, 0.5 deg. resolution Dr. J.J. Remedios, ERCA Space 3
MOPITT data, single day, “model” resolution Single day of “surface” level MOPITT data: 15th July 2004, 2.5 deg. resolution Dr. J.J. Remedios, ERCA Space 3
MOPITT data, 5 days, 0.5 deg. resolution 5 days of “surface” level MOPITT data: 13-17th July 2004, 0.5 deg. resolution Dr. J.J. Remedios, ERCA Space 3
MOPITT data, 5 days, “model” resolution 5 days of “surface” level MOPITT data: 13-17th July 2004, 2.5 deg. resolution Dr. J.J. Remedios, ERCA Space 3
MOPITT data for whole summer 50 days of “surface” level MOPITT data: summer 2004, 0.5 deg. resolution Dr. J.J. Remedios, ERCA Space 3
Deducing horizontal and vertical information Horizontal Spatial information: trade-off is “cloud-free coverage” vs spatial resolution vs temporal resolution vs time Satellite data utility depends on application Vertical Conventional wisdom is satellite is measuring vertical column without good vertical resolution. For infra-red, “conventional” = no sensitivity to surface but not true! Nighttime MOPITT = sensitive to mid-troposphere Daytime MOPITT has some surface sensitivity to lower troposphere when T surface > T atmosphere and more CO near surface Hence day – night is more sensitive to surface/lower troposphere Dr. J.J. Remedios, ERCA Space 3
MONTHLY MEAN, MEXICO CITY. APRIL 2000 MOPITT day (top left), night (top right) and day-night difference (bottom left). 2.5 degree gridded monthly mean surface CO concentrations in the region of Mexico City for April 2000. Also shown (bottom right) are typical day and night mean MOPITT averaging kernels for the Mexico City region of 18-20 degrees North, 98-100 degrees West NGT DAY DY-NT Dr. J.J. Remedios, ERCA Space 3
MONTHLY MEAN U.S. JANUARY 2001 MOPITT day (top left), night (top right) and day-night difference (bottom left) 1 degree gridded monthly mean surface CO concentrations over the United States in January 2001. Also shown (bottom right) are typical day and night mean MOPITT averaging kernels for South Eastern United States in the region of 32-37 degrees North, 85-90 degrees West NGT DAY DY-NT Dr. J.J. Remedios, ERCA Space 3
MONTHLY MEAN, ASIAN EXPORT APRIL 2000 MOPITT day (top left), night (top right) and day-night difference (bottom left) 1 degree gridded monthly mean surface CO concentrations over the United States in January 2001. Also shown (bottom right) are typical day and night mean MOPITT averaging kernels for South Eastern United States in the region of 32-37 degrees North, 85-90 degrees West DAY NGT DY-NT Dr. J.J. Remedios, ERCA Space 3
AFRICAN BIOMASS BURNING: 15th JUNE to 3rd AUGUST 2004 “Source” regions for CO NGT DAY Uplifted air in outflow AATSR FIRES DN-NT Dr. J.J. Remedios, ERCA Space 3
“Surface” level MOPITT monthly mean CO data: INDONESIA October 2002, 0.5 deg. resolution Day Night DY-NT Dr. J.J. Remedios, ERCA Space 3
MIPAS LIMB VIEWING. R. Parker 27/09/02 - Orbit 03006 Ethyne SIMULATION. RED=WITH; BLUE=WITHOUT 9.5 km Ethane ALSO PAN, ACETONE, FORMIC ACID Dr. J.J. Remedios, ERCA Space 3
BIOMASS BURNING SUMMARY • Pyrogenic emissions have a large, varying impact on the troposphere. • CO is a natural marker of biomass burning in the absence of strong industrial pollution. It should provide regional and seasonal estimates of flux into the troposphere but remains a challenge for research. • Satellite CO provides some good information as to origin of air masses. • Exciting development is the observation of organic speciation (see next section) which will permit more precise studies of biomass plume outflow characteristics. Differentiation of outputs from different vegetation types? • Laboratory for looking at inter-annual changes in pollutant chemistry Dr. J.J. Remedios, ERCA Space 3
CONCLUSIONS FOR CO • What can we do now: • Harness the observing power of satellites to provide regional and global information previously unavailable • Megacities • Strong stationary emission sources (can do this for shortwave i/r also and potentially better) • Intercontinental transport of pollution • Global (climate) impact of anthropogenic urban and fire emissions • Inverse modelling to derive regional fluxes • Assimilation to improve daily CO fields Dr. J.J. Remedios, ERCA Space 3
Assimilated MOPITTCO at 3-5 km Dr. J.J. Remedios, ERCA Space 3
Mid-trop /UT limb sounding, i/r instruments: MIPAS on ENVISAT, ACE on SCISAT MIPAS as an example • Limb Sounding, Profiles: 6- 68 km; nominal 3 km vert. resn/spacing (6-48 km) • F.T. i/r emission spectrom: 685-2410 cm-1 in 4 bands. 0.025 cm-1 resn. (unapod.) • Coverage: pole to pole. Profiles every 75 s or approx. 500 km. • VOCs are non-operational products: • Ethane, ethyne, acetone, PAN, formic acid, formaldehyde MIPAS on ENVISAT LAUNCHED ON MARCH 1st 2002 Dr. J.J. Remedios, ERCA Space 3
MIPAS special observation modes at reduced resolution (current mode) Dr. J.J. Remedios, ERCA Space 3
MIPAS Infra-red spectra – unprecedented series of thermal emission spectra Influence of clouds observed as: • distinct spectral offset dependent on optical depth (extinction) • pressure-broadened gas absorption lines from tropospheric radiation scattered into the limb path (cloud location, temp., mean particle size) • characteristic spectral features for NAT PSCs • Influence on trace gas retrievals Comparison of MIPAS spectra for clouds of different optical depth in the field of view, tangent height 15.7 km, 5th May 2003. J. Greenhough, Leicester Dr. J.J. Remedios, ERCA Space 3
DETECTION RESULTS (PAN):Remedios et al., ACP, 2007 Left: ΔY (black) overplotted with ΔF (red) for the 794 cm-1 PAN band fitted for 490 pptv PAN at 10.9 km. Below: Close up of above between 775 – 810 cm-1 with ΔYshifted by -200 nW. Above: ΔY + ΔF for the 1163 cm-1 PAN band also fitted for 490 pptv PAN at 10.9 km. Simultaneous detection of 2PAN bands in separate measurement channels with the same fitted concentrations provide confirmation of detection and accuracy of inferred PAN concentrations. Dr. J.J. Remedios, ERCA Space 3
DETECTION RESULTS (OTHER ORGANICS) ACETONE (540 pptv) 11 km FORMIC ACID (“620 pptv”) 11 km Dr. J.J. Remedios, ERCA Space 3
PAN/Acetone Retrieval method [David Moore] • Optimal estimation • a priori estimates for PAN/Acetone based on mid-latitude MIPAS balloon measurements (300 % a priori covariance) • OPtimal Estimation Retrieval Algorithm (OPERA) • Performs a joint retrieval of a target gas and total particle extinction from MIPAS-E spectral data by integrating spectral signals at each altitude in two distinct regions: • Regions sensitive to target gas • PAN (4 regions between 787 – 790 cm-1) • Acetone (1216.75 – 1217.375 cm-1) • One region sensitive to aerosol/clouds (dependent on the MIPAS-E band) • 832.3125 – 834.4375 cm-1 for band A retrievals (PAN), 1232.25-1234.375 cm-1 for band B retrievals (Acetone) • Allows retrievals in presence of thin cloud in upper troposphere and lower stratosphere • Retrievals performed from reduced-resolution (0.0625 cm-1) MIPAS-l1b spectra (version 4.65) in UTLS-1 mode. • P, T, H2O, O3 and HNO3 - offline l2 products incorporated (v 4.65) • Spectroscopic data from MIPAS spectroscopic database (J.M. Flaud), PAN cross-section (G. Allen); Acetone cross-sections (Alison Waterfall) Dr. J.J. Remedios, ERCA Space 3
Global PAN – 160, 220 mb level • Orbits 12777-12863 • 9-15th August 2004 • 160 mb level (~13km) • 260 mb level (~11 km) Dr. J.J. Remedios, ERCA Space 3
Global PAN – 220 mb level • Orbits 12777-12863 • 9-15th August 2004 • 220 mb level (~ 13 km) Biomass burning? Dr. J.J. Remedios, ERCA Space 3
PAN zonal cross-section • GEOS-CHEM PAN • 9th August 2004 at 12 GMT • OPERA retrieved PAN from MIPAS-E spectra • (9-15th August 2004, orbits 12777-12863) units of pptv Dr. J.J. Remedios, ERCA Space 3
ACETONE – 160 mb • MIPAS-E Orbits 12777-12794 • 9-10th August 2004 ACETONE – 220 mb Dr. J.J. Remedios, ERCA Space 3
Acetone zonal cross-section • OPERA retrieved acetone from MIPAS-E spectra • 9-10th August 2004, orbits 12777-12792 • GEOS-CHEM Acetone • 9th August 2004 at 12 GMT units of pptv Dr. J.J. Remedios, ERCA Space 3