Download
1 / 16
160 likes | 180 Vues
This study highlights the importance of observing tropospheric composition from space for monitoring air quality, forecasting ozone levels, understanding aerosol sources, and evaluating global chemical budgets.

E N D
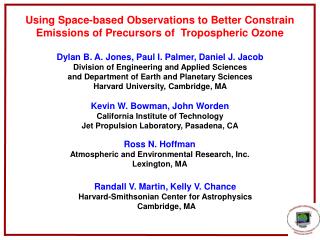
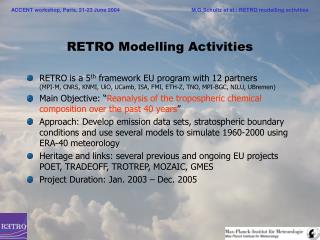
KEY SCIENCE QUESTIONS (TROPOSPHERE AND AIR QUALITY) FOR THE CEOS ATMOSPHERIC COMPOSITION CONSTELLATION Daniel J. Jacob
WHY OBSERVE TROPOSPHERIC COMPOSITION FROM SPACE? Monitoring and forecasting of air quality: ozone, aerosols Long-range transport of pollution Monitoring of sources Global chemical budgets Radiative forcing Need for global coverage, frequent return times; stresses value of Constellation
MAPPING SURFACE PM2.5 USING MISR (2001 data) MISR AOD (annual mean) Validation with AERONET: R2=0.80 Slope=0.88 Convert AOD to surface PM2.5 using scaling factors from chemical transport models MISR PM2.5 EPA (FRM+STN) PM2.5 Evaluate against EPA station data: R = 0.78, Slope = 0.91 Liu et al. [2004] 9-day return time of MISR is major limitation; MODIS has much higher return time but large error because of difficulty of removing surface reflectance.
WILDFIRES: A GROWING AEROSOL SOURCE Total carbonaceous (TC) aerosol averaged over all contiguous U.S. IMPROVE sites S. California fire plumes, Oct. 25 2004 Secondary formation? ~100 IMPROVE sites nationwide • Interannual variability in organic aerosol is largely determined by wildfires • Open fires contribute about 25% of annual mean PM2.5 in the western U.S., 10% in the east • Dominant contributions from western U.S. fires (in the west), Canadian fires (in the northeast), prescribed fires (in the southeast) • U.S. fire source expected to increase over the next decades Park et al. [AE, submitted]
MONITORING AND FORECASTING OF AIR QUALITY: OZONE Frequency distribution of Jun-Aug ozone concentrations at U.S. sites (2001) Natural 18±5 ppbv GEOS-Chem Fiore et al. [JGR 2003] Model background excluding N. American anthropogenic sources: 26±7 ppbv (GEOS-Chem), 29±9 ppbv (MOZART-2) Probability ppbv-1 U.S. CASTNet sites GEOS-Chem model Even if satellites cannot observe surface ozone, observation of the background is of considerable value for air quality models; need multispectral or active ozone sensors to provide vertical resolution in lower free troposphere
OBSERVING INTERCONTINENTAL OZONE POLLUTION 602 hPa TES observations, July 2005 Ozone-CO relationship downwind of Asia Zhang et al. [GRL 2006] TES R=0.64 Slope=0.62 Ozone Ozone (ppbv) ppbv GEOS-Chem with AK R=0.84 Slope=0.50 Carbon monoxide (pppbv) CO ppbv Satellites have unique capability for observing continental outflow, intercontinental transport; need low retrieval error for correlative analyses
INTERCONTINENTAL TRANSPORT OF AEROSOLS clear day April 16, 2001: Asian dust! Glen Canyon, Arizona … anthropogenic pollution is transported together with the dust Heald et al. [JGR 2006] Aerosol optical depth (AOD)Carbon monoxide (CO) MODIS satellite data model (dust) model (sulfate) MOPITT satellite data satellite data satellite data Need correlative measurements, aerosol speciation, active sensing
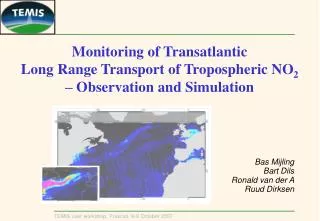
SCIAMACHY 10 a.m. OMI 1:30 p.m. OMI-SCIAMACHY intercomparison of tropospheric NO2 columns: does difference reflect variable diurnal cycle of NOx emissions? Need multiple return times per day with same or well inter-calibrated instruments K.F. Boersma, in prep.
RECENT DECREASE IN U.S. NOx EMISSIONS FROM POWER PLANTS (EPA NOx SIP CALL) Tropospheric NO2 (March 2006) need commitment to calibrated decadal observations to detect trends OMI – GEOS-Chem difference OMI observations GEOS-Chem with EPA 1999 emissions K. F. Boersma, in prep.
FORMALDEHYDE FROM OMI:MAPPING OF REACTIVE VOLATILE ORGANIC COMPOUND (VOC) SOURCES Biogenic isoprene is dominant; anthropogenic source hardly detectable Thomas Kurosu (Harvard/SAO) and Dylan B. Millet (Harvard) Need multiple returns per day to observe ecosystem function
USING ADJOINTS OF CHEMICAL TRANSPORT MODELS TO INVERT SATELLITE DATA FOR EMISSIONS WITH HIGH RESOLUTION MOPITT daily CO columns (Mar-Apr 2001) Correction to model sources of CO Inverse of atmospheric model, optimization by adjoint method A priori emissions from Streets et al. [2003] and Heald et al. [2003] Kopacz et al. [JGR, submitted] Need good coverage, sensitivity to lower troposphere, characterization of observation error
GLOBAL BUDGET OF TROPOSPHERIC OZONE FROM SPACE IR emission measurement from TES UV backscatter measurement from GOME GOME JJA 1997 tropospheric columns (Dobson Units) Liu et al., 2006 Is there a summer maximum over the Middle East? GEOS-Chem model maximum [Li et al., GRL 2001]: Is it real? Need improved ozone retrievals, data for HNO3 in upper troposphere (ACE)
RADICAL BROMINE CHEMISTRY IN TROPOSPHERE GOME satellite instrument observes 0.5-2pptv BrO in excess of what stratospheric models can explain. Large enhancement seen in polar spring; confined to boundary layer or larger extent? Tropospheric BrO from OMI March 11, 2005 (K.V. Chance) Tropospheric BrO ? due to Arctic BL spring bloom Important implications for tropospheric HOx, ozone, NOx, and mercury Need validation of BrO measurements from space, determination of capability to observe background tropospheric BrO
AEROSOL RADIATIVE FORCING OBSERVED FROM SPACE Scattering sulfate and organic aerosol over Massachusetts Partly absorbing dust aerosol downwind of Sahara • Need: • measurements over all incident/scattering angles • accurate characterization of surface reflectance and its BRDF
SECONDARY ORGANIC AEROSOL (SOA):underestimated component of climate forcing? simulated/observed ratios from recent measurement campaigns Volkamer et al. [2006] ACE-Asia free tropospheric data imply AOD from SOA of 0.06 g radiative forcing of -1.2 W m-2 need increased sensitivity of shortwave reflectance measurements, single-scattering albedos, ability to distinguish surface from aerosol reflectances
MONITORING AND FORECASTING OF AIR QUALITY: AEROSOLS Annual mean PM2.5 concentrations (2002)derived from MODIS AODs van Donkelaar et al. [JGR 2007] Need improved accounting of surface reflectivity (multi-angle view such as MISR), vertical distribution (combine lidar with passive)