Download
1 / 14
140 likes | 270 Vues
Retrieval of CH4 Profile from Space-borne Observations. Yuk Ling Yung Caltech. Presented to the ACOS group 28 Jan 2013. Simulated Space-borne Retrievals of Tropospheric Methane Profiles Zhan Su, Vijay Natraj , King-Fai Li, Run-Lie Shia, Charles E. Miller, and Yuk L. Yung

E N D
Retrieval of CH4 Profile from Space-borne Observations Yuk Ling Yung Caltech Presented to the ACOS group 28Jan 2013
Simulated Space-borne Retrievals of Tropospheric Methane Profiles • Zhan Su, Vijay Natraj, King-Fai Li, Run-Lie Shia, Charles E. Miller, and Yuk L. Yung • http://yly-mac.gps.caltech.edu/ReprintsYLY/A_RecentPapers/su%202012%20ch4/
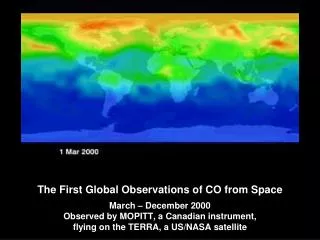
Spaceborne measurements of CH4 profile http://www.landcareresearch.co.nz/research/globalchange/climate_change.asp
Satellite measurements Aircraft and ground-based observations Methane Retrieval Goal and StrategyRetrieve methane with uncertainty less than 1% CH4 concentration CH4 Spectrum measurements Retrieval method Accurate but sparse. Cover most area of earth but not very accurate
Retrieval method: Rodgers [2000] a prioriknowledge: CH4 ~ (1650 ± 55 ) ppb Bayesian approach: combine a prioriknowledge and Radiance measurement to constrain the solution. Use CH4 band (1.6, 2.3 um) and O2-A band to retrieve CH4, surface albedo, surface pressure, temperature scaling factor, water vapor scaling factor, aerosol optical depth etc.
Same as Figure in last slide but include 1000 channels (i.e., every 10 cm-1 with the resolution of 0.01 cm-1) for each DOF calculation (denoted as circle). (top) for the 2.3 μm band. (bottom) for the 1.6 μm band. from our numerical study, we found that the DOF by all 56,000 channels (32,000 from 2.3 μm band and 24,000 from 1.6 μm band) should not exceed 4.4. We finally select 615 CH4 channels out of 56,000 CH4 channels (~ 1.1%) to provide more than 95% (~ 4.22/4.4) of the total CH4 information.
(left) Accumulated DOF of CH4 in the window 4210–4220 cm–1 with resolution of 0.01 cm–1. This calculation begins at 4210.0 cm-1 and then starts summing DOF value from 4210.01to 4220.00 cm-1 in steps of 0.01 cm-1. (right) Accumulated DOF of CH4 by the selected 615 channels in Table 2. The red circles denote channels with DOF contribution ≥0.005 while blue circles denote the other channels.
DOF of CH4 by the window 4210–4220 cm–1 with spectral resolution and SNR. Generally speaking, higher resolution and SNR lead to larger DOF. The sensitivity of DOF to different resolution and SNR can be very different: DOF has low sensitivity in the region of SNR of 500 to 1000 and resolution of 0.31 to 0.51 cm-1 while DOF has large sensitivity in the region of SNR of 100 to 600 and resolution of 0.01 cm-1 to 0.21 cm-1.
The Jacobian changing vertically explain the source of profile information of retrieval
Circles in top figures denote the position of 15 layers in the model. Solid lines denote different bulk layers which are connected by dashed lines. Blue, red and black colors in top figures represent the true, a priori and retrieved CH4 profiles respectively in the three tests. Squares in bottom figures indicate that the averaged CH4 biases of each bulk layer are within 18 ppb (~ 1%). This figure shows that our algorithm can detect local source of CH4.
Summary: 1, We use information content theory to analyze the CH4 1.6 and 2.3 um band, and select channel which contain large information. We find 1% of channels contain 95% of total information. We find with resolution of 0.01 cm-1 resolution and SNR=300, DOF of CH4 with selected channels can reach ~4. With resolution of 0.2 cm-1, DOF is around 3. These results depend on SZA, albedo and others though. 2, By Rodgers’ retrieval method, Numerical simulation shows we can retrieve 3~4 pieces of CH4 layers by the selected channels.
Acknowledgements • Yung’s Group at Caltech • Zhan Su (Caltech PS grad student) • Chip Miller + Vijay Natraj