Download
1 / 17
170 likes | 363 Vues
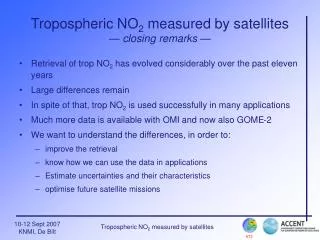
Analysis of A-Train Tropospheric NO 2 and Aerosol Data. Pepijn Veefkind. OMI Tropospheric NO 2 2005-2007 Linear color scale from 0-1.3 10 16 molecules/cm 2. OMI Tropospheric NO 2 2005-2007 Linear color scale from 0-0.5 10 16 molecules/cm 2. Sources of NO x and Aerosol.

E N D
Analysis of A-Train Tropospheric NO2 and Aerosol Data Pepijn Veefkind
OMI Tropospheric NO2 2005-2007 Linear color scale from 0-1.3 1016 molecules/cm2
OMI Tropospheric NO2 2005-2007 Linear color scale from 0-0.5 1016 molecules/cm2
Sources of NOx and Aerosol In Europe NOx is an important precursorfor ammonium nitrate particles
Total Emissions from of SOx and NOx in Europe for 1995 Data taken from Schaap et al. ACP 4, 857-874, 2004
OMI NO2 and MODIS AOT OMI Tropospheric NO2 MODIS AOT at 550 nm West-Europe East Europe Mediterenean Time period 2005-2007 Gridded 1x1 degree
Total Emissions from of SOx and NOx in Europe for 1995 NOx SOx Image from Schaap et al. ACP 4, 857-874, 2004 In Eastern Europe more SOx is emitted per unit NOx,leading to more aerosol mass per unit NOx and toa larger slope between the NO2 concentration and AOT
Global Analysis • OMI NO2 Domino Product monthly mean (regridded 1x1 degree) • MODIS Aqua AOD at 550 nm monthly mean, (1x1 degree) • Correlation calculated for 10x10 degree regions (max 100 points, at least 50 co-locations) • Data is filtered for tropospheric NO2 larger than 5x10¹⁴ molec./cm2 • Data period 2005-2007
AOD Trop. NO2
Sulfate Organic Carbon MODIS Aqua Dust GOCART Model Data from the NASA GIOVANNI web site
NW Europe E USA Beijng E Coast Africa
Summary • High spatial resolution gridded data set of OMI tropospheric NO2 data over Europe; • Significant correlation between AOT and tropospheric NO2 is observed in both industrial and biomass burning regions. • The slope between tropospheric NO2 and AOT is larger for East Europe as compared to West Europe, which may be explained by the difference of NOx and SO2 emissions; • The combined analysis of AOD and tropospheric NO2 provide information on the aerosol sources.
Ground Based In-Situ Data • LML Dutch air quality network, www.rivm.nl/lml • Regional, City and Street stations • Mean yearly value per station for 12:00 to 14:00 hrs
Comparison with the LML Data from October 2004 to September 2005