Tropospheric Ozone Chemistry
370 likes | 1.2k Vues
Tropospheric Ozone Chemistry. Outline: - Solar radiation and chemistry - Tropospheric ozone production - Methane oxidation cycle - Nitrogen species - A look at global tropospheric ozone - Oxidizing capacity of the troposphere. David Plummer presented at the GCC Summer School

Tropospheric Ozone Chemistry
E N D
Presentation Transcript
Tropospheric Ozone Chemistry Outline: - Solar radiation and chemistry - Tropospheric ozone production - Methane oxidation cycle - Nitrogen species - A look at global tropospheric ozone - Oxidizing capacity of the troposphere David Plummer presented at the GCC Summer School Montreal, August 7-13, 2003
Ozone in the atmosphere • 90% of total column O3 is found in the stratosphere Timeseries of ozone profiles over Edmonton for 2002. From World Ozone Data Centre (www.woudc.org)
Solar radiation and chemistry • the reaction that produces ozone in the atmosphere: O + O2 + M O3 + M • difference between stratospheric and tropospheric ozone generation is in the source of atomic O • for solar radiation with a wavelength of less than 242 nm: O2 + hv O + O
little radiation with wavelengths less than ~290 nm makes it down to the troposphere Solar spectral actinic flux calculated at 50, 40, 30, 20 and 0 km above the surface. From DeMore et al., 1997.
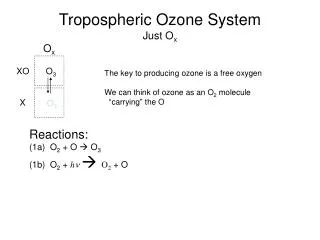
photochemical production of O3 in troposphere tied to NOx (NO + NO2) • for wavelengths less than 424 nm: NO2 + hv NO + O • but NO will react with O3 NO + O3 NO2 • cycling hasno net effect on ozone
NO2 + hv (+O2) NO + O3 J1 NO + O3 NO2 K1 O3-NO-NO2 photochemical steady state • consider the two reactions just seen • ignoring other reactions, during daylight this forms a fast cycle in steady-state d[NO2]/dt = Prod - Loss = 0 K1[NO][O3] = J1[NO2] [NO]/[NO2] = J1/K1[O3] • partioning of NOx between NO and NO2 has important implications for removal of NOx from the atmosphere
presence of peroxy radicals, from the oxidation of hydrocarbons, disturbs O3-NO-NO2 cycle NO + HO2· NO2 + OH· NO + RO2· NO2 + RO· • leads to net production of ozone
The Hydroxyl Radical • produced from ozone photolysis • for radiation with wavelengths less than 320 nm: O3 + hv O(1D) + O2 followed by O(1D) + M O(3P) + M (+O2O3) (~90%) O(1D) + H2O 2 OH· (~10%) • OH initiates the atmospheric oxidation of a wide range of compounds in the atmosphere • referred to as ‘detergent of the atmosphere’ • typical concentrations near the surface ~106 - 107cm-3 • very reactive, effectively recycled
Oxidation of CO - production of ozone CO + OH· CO2 + H· H· + O2 + M HO2· + M NO + HO2· NO2 + OH· NO2 + hv NO + O O + O2 + M O3 CO + 2 O2 + hv CO2 + O3
What breaks the cycle? • cycle terminated by OH· + NO2 HNO3 HO2· + HO2· H2O2 • both HNO3 and H2O2 will photolyze or react with OH to, in effect, reverse these pathways • but reactions are slow (lifetime of several days) • both are very soluble - though H2O2 less-so • washout by precipitation • dry deposition • in PBL they are effectively a loss • situation is more complicated in the upper troposphere • no dry deposition, limited wet removal
Methane Oxidation Cycle • CH4 is simplest alkane species • features of oxidation cycle common to other organic compounds • long photochemical lifetime • fairly evenly distributed throughout troposphere • concentrations ~1.8ppmv • reactions form ‘bedrock’ of the chemistry in the background troposphere
CH4 + OH· CH3· + H2O CH3· + O2 + M CH3O2· + M CH3O2· + NO CH3O· + NO2 CH3O· +O2 HCHO + HO2· HO2· + NO OH· + NO2 2{NO2 + hv (+O2) NO + O3} CH4 + 4 O2 + 2 hv HCHO + 2O3 + H2O • HCHO will also undergo further reaction HCHO + hv H2 + CO H· + HCO HCHO + OH HCO + H2O HCO + O2 HO2· + CO H· + O2 HO2·
Cycle limiting reactions OH· + NO2 HNO3 HO2· + HO2· H2O2 but also HO2· + CH3O2· CH3OOH + O2 • methyl hydroperoxide (CH3OOH) • can photolyze or react with OH with a lifetime of ~ 2 days • return radicals to system • important source of radicals in upper tropical troposphere • moderately soluble and can be removed from atmosphere by wet or dry deposition • loss of radicals
Conceptually • photolysis of ozone most significant source of OH • atmospheric oxidation of hydrocarbons initiated by OH radical • production of peroxy radicals (HO2, RO2) which interact with O3-NO-NO2 cycle to photo-chemically produce ozone • produce carbonyl compounds (aldehydes and ketones) which undergo further oxidation • recycling of OH • termination by formation of nitric acid (OH + NO2 HNO3) or peroxides (H2O2, ROOH)
Nitrogen species • NOx (NO + NO2) plays a critical role in the atmospheric oxidation of hydrocarbons • short chemical lifetime • from ~ 6 hours in PBL to several days to a week in the upper troposphere • large variations in concentration • from 10s ppbv in urban areas to 10s pptv in remote regions (UT and remote MBL) • gives rise to different chemical regimes
Regional Ozone perspective - O3 production • More accurate to talk of NOx/VOC ratio • VOC - volatile organic carbon • High NOx/VOC environments • OH reaction with NO2 dominates • NO-NO2 cycling inefficient compared with NOx loss • only found in urban areas • Low NOx/VOC environments • high peroxy radical concentrations • peroxy radical self-reactions become important sink for radicals • production of H2O2 and ROOH
Global perspective • NOx concentrations almost always low enough that ozone production is NOx limited • globally NOx concentrations control whether local chemistry creates or destroys ozone • for [NOx] less than ~20 pptv, chemistry results in net ozone destruction • no NOx to turn-over the NO-NO2 cycle O3+ hv O(1D) + O2 O(1D) + H2O 2 OH· • also HO2· + O3 OH· + 2 O2 • particularly important in tropical marine boundary layer
Other nitrogen species • Peroxyacyl nitrates (PANs) • most important being peroxyacetyl nitrate • CH3C(O)OONO2 • formed from oxidation of acetaldehyde CH3CHO + OH· (+ O2) CH3C(O)O2 + H2O CH3C(O)O2 + NO2 + M CH3C(O)O2NO2 + M • decomposition is strongly temperature dependent • from 30 minutes at 298K near the surface to several months under upper tropospheric conditions • NOx exported from boundary layer to remote troposphere in the form of PAN • observations show PAN is dominant NOy compound in northern hemisphere spring troposphere • insoluble
Other nitrogen species • N2O5 • formed by NO2 + O3 NO3 + O2 NO2 + NO3 N2O5 • most important is what happens to N2O5 N2O5 + H2O(s) 2 HNO3 • during daylight fast photolysis of NO3 limits production of N2O5: NO3 + hv NO2 + O
especially important NOx sink at higher latitudes and in winter - particularly northern hemisphere • OH concentrations much lower The calculated reduction in NOx and O3 amounts in the MOZART model with the inclusion of N2O5 hydrolysis. From Tie et al. 2001.
NOx Sources Estimates of annual global NOx emissions for the early 1990s. Units of Tg-N/year. • Biomass burning includes savannah burning, tropical deforestation, temperate wildfires and agricultural waste burning • Soil emission • enhanced by application of fertilizers • largest uncertainty is in estimates of canopy transmission • Lightning • models use ~5.0 Tg-N/yr • scaling up from observations suggest 20 Tg-N/yr
Impacts of NOx emission • by mass, most NOx is emitted at the surface • chemical impacts of NOx very non-linear • limited impact in the continental PBL • high OH and high NO2/NO ratio near surface result in a short photo-chemical lifetime • NOx concentrations are already substantial • per molecule, impact of NOx much greater in free troposphere • venting to the free troposphere important • emissions that occur in free troposphere • aircraft, lightning
Global tropospheric ozone • Seasonal cycle of O3 concentrations at different pressure levels, derived from ozonesonde data at eight different stations in the northern hemisphere. From Logan, J. Geophys. Res., 16115-16149, 1999. • Remote northern stations • spring-time maximum • nearer to industrial emissions • broader maximum stretching through summer
O3 at the surface • Seasonal cycle of O3 concentrations at the surface for different rural locations in the United States. • From Logan, J. Geophys. Res., 16115-16149, 1999. • Surface sites in industrialized regions show an even more pronounced summer-time peak
Global distribution • Spatial distribution of climatological O3 concentrations at 1000hPa. • From Logan, J. Geophys. Res., 16115-16149, 1999. • constructed from surface observations, ozonesondes and a bit of intuition • note very low concentrations over tropical Pacific ocean
Measurements from satellite • Data from asd-www.larc.nasa.gov/TOR/data.html • See Fishman et al., Atmos. Chem. Phys., 3, 893-907, 2003. • Tropospheric residual method • total column (from TOMS) - stratospheric column (SBUV)
Tropospheric ozone budget • derived from models • a typical budget for present-day conditions: From Lelieveld and Dentener, J. Geophys. Res., 3531-3551, 105, 2000
Range of model predictions • all global models compared to available measurements • comparisons becoming more sophisticated • all show believable ozone • budgets show large spread in individual terms Adopted from von Kuhlmann et al., J. Geophys. Res., in press, 2003.
Future concerns • How much have emissions of precursors perturbed ozone already? • Ozone is reactive • no ice-core records • some re-constructed records • Montsouris measurements suggested surface O3 was ~10 ppbv • other information from model simulations • emissions, particularly biomass burning, hard to quantify • suggest tropospheric ozone burden has increased between 25 and 60% since pre-industrial
The more recent past • Statistically significant negative trends of 1-2% per year found at several stations in Canada for 1980-1993 (Tarasick et al., Geophys. Res. Lett., 409-412, 22, 1995) • trends at most other stations in NH ambiguous • Monthly averaged O3 concentration between 630 and 400 hPa from 9 ozonesonde stations located between 36 and 59N. From Logan et al. J. Geophys. Res., 104, 26373-26399, 1999.
IPCC OxComp simulations for 2100 • Emissions for year 2100 were a bit of a ‘worst case’ scenario CH4 = 4.3 ppmv; NOx = 110 Tg-N/yr (32.5) CO = 2500 Tg/yr (1050); VOC = 350 Tg/yr (150) • mid-latitude O3 increases by 20-30 ppbv at the surface • puts background O3 in 60-70 ppbv range • these models did not include impacts of global warming • increased H2O vapour • temperature effects on reaction rates • increasingly coupled models • inclusion of biosphere-atmosphere interactions • lightning
Stability of global OH • OH originates with O3 • very reactive and very short-lived • recycling critically important • OH is responsible for initiating atmospheric oxidation of hydrocarbons • CH4 lifetime of ~10 years • are changes in chemical composition of the troposphere affecting average OH?
Information from methyl chloroform • CH3CCl3 used as solvent by industry • atmospheric lifetime of 5-6 years • main loss by reaction with OH • some entered stratosphere and enhanced Cl levels • banned under Montreal protocol • use was to stop in 1996 in developed countries • assuming one knows the sources of MCF, it is possible to calculate an average global OH by fitting to observed decay
Observed MCF concentrations at Barbados. Vertical bars represent the monthly standard deviations. Different colour symbols represent measurements made as part of different networks. See Prinn et al., J. Geophys. Res., 105, 17751-17792, 2000.
Minor changes in the time profile of emissions can give constant OH • banking of MCF in early 1990s • release in late 1990s • aircraft observations of plumes of MCF in 2000 over Europe • Global average OH determined from fitting to observed MCF concentrations over 3 and 5 year periods and as a second-order polynomial. From Krol and Lelieveld, J. Geophys. Res., in press, 2002.