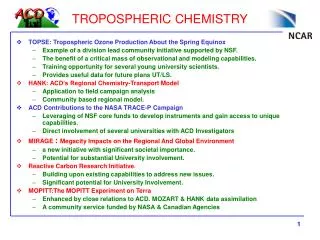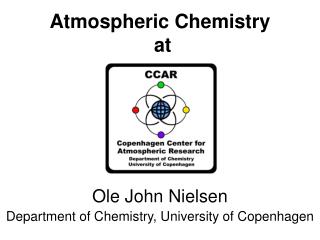
This Week—Tropospheric Chemistry
This Week—Tropospheric Chemistry. READING: Chapter 11 of text Tropospheric Chemistry Data Set Analysis. The Atmosphere: Oxidizing Medium. Oxidation. Oxidized gas/ aerosol. Reduced gas. Uptake. EARTH SURFACE. Emission. Reduction. O( 1 D) Production in Troposphere?.

This Week—Tropospheric Chemistry
E N D
Presentation Transcript
This Week—Tropospheric Chemistry READING: Chapter 11 of text Tropospheric Chemistry Data Set Analysis
The Atmosphere: Oxidizing Medium Oxidation Oxidized gas/ aerosol Reduced gas Uptake EARTH SURFACE Emission Reduction
O(1D) Production in Troposphere? Actinic Flux vs wavelength (O1D production requires < 320nm) 30o equinox midday Solar spectrum
OH Radical: Main Tropospheric Oxidant Primary source: O3 + hv O2 + O(1D) (1) O(1D) + M O + M (2) O(1D) + H2O 2OH(3) Sink: oxidation of reduced species CO + OH CO2 + H CH4 + OH CH3 + H2O HCFC + OH H2O + … Major OH sinks globally GLOBAL MEAN [OH] = 1.0x10⁶ molecules cm-3
Questions • How would a thinning of the stratospheric ozone layer affect thesource of OH in the troposphere? • 2. How might global warming affect the source rate of OH in the troposphere?
Global Sources of Methane Anthropogenic Sources Natural Sources
Global Distribution of Methane NOAA/CMDL surface air measurements
Historical Trends In Methane Recent methane trend Historical methane trend
Satellite Measurements Lower Tropospheric CO
Satellite Measurements Upper Tropospheric CO
Global Distribution of CO NOAA/CMDL surface air measurements
OH Titration Problem X X Stratosphere O3 1-2 x10¹³ moles yr-1 Troposphere 2-4 x10¹³ moles yr-1 H2O O3 + hv 2OH OH only from strat O3 would be titrated CO CH4 6-10 x1013 moles yr-1 3 x10¹³ moles yr-1
HOx and NOx Catalyzed O3 Production H2O O3 + h CH4 CH3O2 OH CO NO NO O2 HO2 CH3O H2CO + h O2 O2 H2CO O2 O3 O NO CH3O2 h HO2 NO2
Questions • NO also reacts with O3 (as in the stratosphere) to produce NO2. In fact, the rate of conversion of NO to NO2 is dominated by this reaction in the troposphere. What is the effect of this reaction on O3production and HOx cycling? • Loss of NOx in the troposphere takes place by NO2+OHHNO3, same as in the stratosphere. What is the effect of this reaction on tropospheric ozone? • What’s the maximum number of O3 that can be produced from the oxidation of 1 CH4?
Tropospheric NOx Sources (Tg N yr-1) Probably bigger according to recent UW ATMSCI research STRATOSPHERE 0.2 LIGHTNING 5.8 SOILS 5.1 FOSSIL FUEL 23.1 BIOMASS BURNING 5.2 BIOFUEL 2.2 AIRCRAFT 0.5
Tropospheric NO2 from Space NOx Lifetime < 1 day! Fraction transported away from source regions very low Martin et al. [2002]
Lightning Flashes From Space DJF JJA
Long-Range Transport of NOx By NOx Reservoir: Peroxyacetyl Nitrate (PAN)
HO RO CO2 h NO NOx Sources in Remote Regions CO RH HO2 RO2 O3 HO2NO2 RO2NO2 NO2
Questions • How would you calculate the chemical lifetime of NOx? • Sketch a typical vertical profile for NOx. • Anthropogenic activity has lead to the increase of NOx, CO, and CH4 emissions, with roughly factors of 2-4 increases of each over pre-industrial times. How have these changes affected OH concentrations?
Predicted Change Since Pre-Industrial Times CO and CH4 tend to decrease OH NOx and O3 tend to increase OH [OH]global ~ constant
Global Distribution of Ozone January What are the main controls on tropospheric O3? August
Global Tropospheric O3 Budget O3 Stratosphere 400-1100 Tg yr-1 Flux from Stratosphere Troposphere 3400-5700 Tg yr-1 O3 Chemical Production During NOx/HOx catalyzed photo-oxidation of CO, CH4 3000-4200 Tg yr-1 o o Chemical Loss HOx catalyzed destruction O(1D) + H2O 500-1500 Tg yr-1 Deposition