Tropospheric Ozone Changes Preliminary Workshop Summary
Tropospheric Ozone Changes Preliminary Workshop Summary. Toulouse, 11-13 April 2011. Tropospheric ozone change from preindustrial to present. %. 4/10 models. Gauss et al., 2006 (ACP). Tarasova. Agenda. Monday Session 1 – Data analysis in the UT/LS, global analysis Poster Session

Tropospheric Ozone Changes Preliminary Workshop Summary
E N D
Presentation Transcript
Tropospheric Ozone Changes Preliminary Workshop Summary Toulouse, 11-13 April 2011
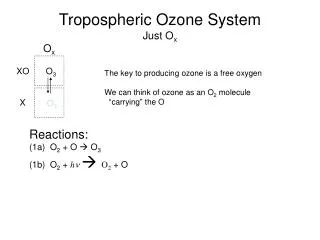
Tropospheric ozone change from preindustrial to present % 4/10 models Gauss et al., 2006 (ACP)
Agenda • Monday • Session 1 – Data analysis in the UT/LS, global analysis • Poster Session • Session 2 – Data analysis over Asia • Tuesday • Session 3 – Data analysis over SH and Tropics • Session 4 – Updates of analyses over North America and Europe • Session 5 – Discussion session: State-of-the-art and future needs • Wednesday • Session 6 – Evaluation of long-term model runs • Session 7 – Common methodologies and standard data sets
5. 6. 7.
Tropospheric Ozone Standard Deviation 30-90oN Hess&Zbinden TOTAL Solid: Intregated Below 300 hPa Dotted: At 500 hPa Dashed: At Surface STRATOS ANTHRO • Stratosphere Explains Large Scale Variance • Stratosphere Explains 81% of the area averaged variance at 500 hPa • Stratosphere Explains 77% of the area averaged variance at surface • Stratosphere Explains Much Less of Site Level Variance • Stratosphere Explains on average 50% of variance at particular sites at 500 hPa • Stratosphere Explains 25% of the variance at particular sites at surface
Logan: Japan summary Arshinov: „TOR“ Siberia X. Xu: Mt. Waliguan Cristofanelli: Nepal Zbinden: Japan Asian measurements Naha=tropical
Cape Grim Surface Ozone Seasonal Trend Analysis based on monthly anomalies. Surface ozone in Austral spring (SON) and summer (DJF) show positive trends in the 1980’s and 1990’s and non-significant trends in the 2000’s and positive trends over the three decades combined Surface ozone in Austral autumn (MAM) and winter (JJA) show non-significant trends in each of the three decades. Over the three decades there are ambivalent results concerning an upward trend in these seasons. Southern Hemisphere and Tropics Galbally
Overlaying Ushuaia, Cape Point and Cape Grim gives very coherent time series Luppo and Cupeiro
Tropical upper troposphere SHADOZ MOZAIC Cammas et al. Morioka et al.
MOZAIC Sondes Europe Logan Gilge
US surface ozone trends Lefohn Trend depends on the metrics you choose
How well do we model tropospheric ozone? Stevenson et al. 2006 (ACCENT)
Publication(s) Collect and post presentations:default=use what’s there, updates by 30 April Proceedings! Oksana to provide template very soon; deadline for submission: mid June IGAC Newsletter: deadline mid August; also consider SPARC newsletter, deadline November – don’t forget EOS Review article(s). HTAP (Parrish), ACCENT plus (Monks), « global » review article? Discussion: way forward of this initiative Database(s) Identify suitable data sets as common starting point for modelers: Define core (or benchmark) subset with sufficient density and quality … !
Future activities(discussion not concluded yet) Establish expert-team on tropospheric ozone in GAW Establish specific tasks (O3 sondes reana, databases; metrics/diagnostics, transcom process…) Organize task meetings Another big workshop? Opportunities: Ozone symposium Toronto (August 2012) ACCENT Plus (Urbino)
(Common) method for model evaluation ? • Common period ? • Background ? • Quantitatively / qualitatively • Differences surface/FT/UT/LS • Main processes & emissions : how well are they reproduced ? • Seasonal behaviors • Strat-trop exchanges • El-Nino • Climate changes ? (GHG, O3 hole/recovery) • Asian emissions ?
UTLS ozone: a new definition for the tropopause „e90“ tropopause M.J. Prather, X. Zhu , Q. Tang , J. Hsu , J.L. Neu (2011), An atmospheric chemist in search of the tropopause, J. Geophys. Res., 116: D04306, doi:10.1029/2010JD014939.
Oman et al. Ziemke Ozone ENSO Index
Summary statements • Datasets: • Network density and length of time series rather inhomogeneous across the world • Europe has probably highest density: yet issues with consistency • Data sampling frequency remains a problem for free troposphere
Summary statements • (Global) Models: • can successfully reproduce seasonal cycles and magnitude of tropospheric ozone • more and more models capture some aspects of interannual variability, in particular in free troposphere • fail to reproduce decadal surface ozone changes (when compared to „key data sets“) • Reasons unclear need a more systematic community approach (AEROCOM strategy) • Topics: strato. (STE) changes, biogenic emissions, vertical mixing, emission changes, chemical processes(?)
Summary statements • General: • More focus on variability and „patterns“ rather than trends • Avoid the term „background“ • Need to assess climate variability before attributing trends • Try to make use of the momentum of an assessment? • Tropospheric ozone is (still) very interesting!