Download
1 / 15
150 likes | 327 Vues
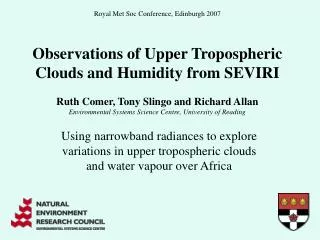
Royal Met Soc Conference, Edinburgh 2007. Observations of Upper Tropospheric Clouds and Humidity from SEVIRI Ruth Comer, Tony Slingo and Richard Allan Environmental Systems Science Centre, University of Reading.

E N D
Royal Met Soc Conference, Edinburgh 2007 Observations of Upper Tropospheric Clouds and Humidity from SEVIRI Ruth Comer, Tony Slingo and Richard Allan Environmental Systems Science Centre, University of Reading Using narrowband radiances to explore variations in upper tropospheric clouds and water vapour over Africa
Motivation – the Diurnal Cycle • Fundamental mode of atmospheric variability • Poorly represented in climate and NWP models • Clouds and humidity important for radiation budget • Diurnal cycle of water vapour has received relatively little attention (Soden, 2000 GRL; Tian et al., 2004 JGR) • Extension of Soden’s (2000) study
SEVIRI – Spinning Enhanced Visible and Infra-Red Imager • Meteosat-8 (MSG1) • Geostationary over Africa • 12 Visible and IR channels including • - 10.8 µm window channel • - 6.2 µm water vapour channel • 3712 by 3712 pixels give 3km resolution at nadir • 15 minute time intervals • Here using July 2004 data
Tb10.8 Tb6.2 Method Convert window and WV channels to brightness temperature Mask WV where Tb10.8- Tb6.2 < 25K Average non-masked Tb6.2 over month Instances of masked pixels over month approximate high cloud cover Tb6.2 (masked) Tb10.8- Tb6.2
From Soden (2000) GRL CLD WVC
CLD WVC
CLD WVC
Diurnal Cycle – Summary • Large-scale analysis shows 2 hour time-lag between CLD and WVC, similar to Soden (2000) • Focus on smaller convective regions shows WVC in phase with, or preceding CLD • Possible reasons for discrepancy • - Sampling issues inherent in method • - Movement of cloud in this region • Move on to methods for following atmospheric motion
Tracking – focus on Tibesti CLD WVC 2nd July cloud event – identified 1030Z
Tracking – focus on Tibesti 2nd July cloud event – identified 1030Z
Restrict to ITCZ land region • Divide into 4-pixel-wide columns (348) • Average cloud amount and WVC for each column ITCZ variation • Convection density too high for tracking method
ITCZ variation - Results % Cloud amount by column and time (UT) Westward advection ~15ms-1 Convectively Coupled Kelvin Waves (c.f. Wheeler & Kiladis, 1999 JAS) ~10ms-1
ITCZ variation - Results WVC (K) by column and time (UT) Humidity peaks with cloud but tails off more slowly
Summary • Upper tropospheric humidity lags cloud, probably due to evaporation • Relationship complicated by atmospheric motion • Methods developed to analyse variations more closely • - Tracking • - Hovmoller analysis
Potential Future Work • Use similar methods for January data in southern hemisphere • - Less winds to worry about • Explore alternative tracking techniques for ITCZ region • Explore use of additional data sources to replace humidity in areas of high cloud • Comparison with in situ measurements from RADAGAST • - Observing clouds from below as well as above