Download
1 / 31
310 likes | 449 Vues
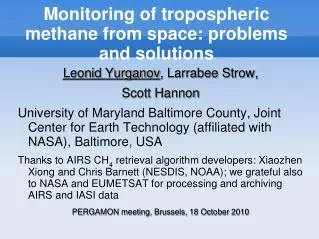
Monitoring of tropospheric methane from space: problems and solutions. Leonid Yurganov , Larrabee Strow, Scott Hannon University of Maryland Baltimore County, Joint Center for Earth Technology (affiliated with NASA), Baltimore, USA

E N D
Monitoring of tropospheric methane from space: problems and solutions Leonid Yurganov, Larrabee Strow, Scott Hannon University of Maryland Baltimore County, Joint Center for Earth Technology (affiliated with NASA), Baltimore, USA Thanks to AIRS CH4 retrieval algorithm developers: Xiaozhen Xiong and Chris Barnett (NESDIS, NOAA); we grateful also to NASA and EUMETSAT for processing and archiving AIRS and IASI data PERGAMON meeting, Brussels, 18 October 2010
Outline • Terminology and definitions • Thermal vs solar • Measurements: CH4 vs CO The report is based on AIRS and IASI sensors: • Siberia: vertical extent of surface influence • Wetlands, global & hemispheric CH4 patterns • CH4 distributions in the high NH
Atmosphere Altitude, km Air pressure, hPa (mb) Stratosphere Tropopause 250 10 Free troposphere 1.5 850 Boundary layer 1000 0
Solar and thermal IR radiation T ~ 6000 K Thermal (or terrestrial) radiance has a maximum near λ~10 μm (ν=1/λ=1000 cm-1) Solar radiance has a maximum near λ~ 0.5 μm, and it is attenuated by scattering, clouds, aerosol, etc T ~ 270-300 K
There are methane absorption lines in both spectral intervals. Important parameters of spectrometers • Spectral resolution (the finer the better) • Spatial resolution (the finer the better) • Swath (the wider the better) • Signal to Noise Ratio (the larger the better) • Vertical sensitivity (the deeper the better)
AIRS and IASI • Both are at polar sun-synchronous orbits. • AIRS/Aqua: Atmospheric Infrared Sounder, since September 2002, grating spectrometer, resolution around 7.7 μm: 0.8 cm-1. Swath ± 670 km. Maximum spatial resolution 2.3 km. • IASI/Metop-A: Infrared Atmospheric Sounding Interferometer, since July 2007. Resolution 0.5 cm-1. Swath ± 1066 km. Spatial resolution 18 km
Volume mixing ratio (VMR), ppm or ppb, molecules per molecules of dry air • Total column amount (TC), molecules/cm2. A convenient formula to convert VMR in TC: TC = Σ ( VMR(ppb) * Δ P(mb) * 2.12E13) • XCH4 = TCch4 /TCair Mean atmospheric VMR
Carbon monoxide • This is an example of easily measurable gas. It varyes in the normal, undisturbed troposphere between 50 ppb in the South Hemisphere (SH) and 120 ppb in the Northern Hemisphere (NH). • Forest fires in Russia in July – August 2010.
Can we measure CH4 with a similar time resolution in the Arctic or anywhere? Main problems. • Low variability of methane, even near the surface (less than 10%, usually 2-3% ). • Low sensitivity of thermal spectra to the boundary layer and water vapor spectral contamination. • Low Signal to Noise Ratio of solar spectra in some methane bands (low detector sensitivity) .
Vertical sensitivity: averaging kernel (AK) Matrix equation Retrieved = A-priori + AK * (True - A-priori) • If AK=1, Retrieved = True; If AK=0, Retrieved = A-priori. 6 km 0 km
IASI: Thermal vs sol/therm channels Averaing kernels for CH4 TC, IASI, AK should be 1.0 Thermal/solar channels near 3.6 μm Thermal channels near 7.7 μm
Validations and comparisons ♦Validation is the only way to decide if a space-based sensor supplies reasonable data. ♦Here we use excelent Russia/Japan long-term aircraft data series in West Siberia (see recent paper Vertical Distribution of Greenhouse Gases above Western Siberia by the Long-Term Measurement Data, by Arshinov et al., Atm. Ocean. Opt. (2009). ♦What is the vertical extent of wetland methane emission influence?
Northern wetlands Alert Surgut Fraserdale
Wetland methane Magnitude and seasonality of wetland methane emissions, C. A. Pickett-Heaps et al., ACPD (2010) Vertical Distribution of Greenhouse Gases above Western Siberia by the Long-Term Measurement Data, Arshinov et al., Atm. Ocean. Opt. (2009) Canada Siberia Blue – surface measurements Wetland Arctic
Surgut: what AIRS should see?Measured methane profiles were convolved with AKs and a-priori profiles(just a computer simulation)
What does AIRS really see? Convolved aircraft Retrieved from spectra
This comparison allows us to assume that AIRS's CH4 reportedfor the 200, 300, and 400 hPa levels are sensitive also to lower atmospheric levels (namely ~ 3-5 km asl, or even below that). • Furher AIRS data will be compared with measurements at the NOAA surface network
AIRS and surface NH measurements (seasonal cycles averaged over 2003-2009) Surface NH AIRS NH
ESRL/NOAA has global CH4 surface record since 1983. AIRS started in 2002. (referenced to 2003-2007) ESRL data courtesy of Ed Dlugokencky, NOAA
In summer 2010 West Siberian CH4 dropped to mean values of 2003 – 2007 due to low temperature Surgut Surgut CH4 methane anomaly
Comparison of CH4 and CO for the period of Russian fires (July-August, 2010)
Antarctic enigma: methane anomaly appears in West Antarctica every November and disappers afterwards AIRS, retrieval for 400 mb, December 2008
Conclusions • AIRS V5 standard methane retrievals are sensitive not only to the upper troposphere, but also to the lower part of the troposphere. • Methane, after a period of growing, reached a peak in the middle of 2009, declined, and now is stable . Thank you!