Download

1 / 65
680 likes | 1.17k Vues
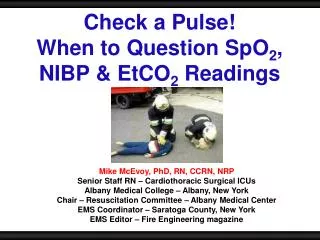
End Tidal CO 2 (EtCO 2 ) Monitoring. EtCO 2 Monitoring. “Snapshot in time” Assists with patient assessment BUT: –Do NOT replace eyes-on/hands-on care –Are just one piece of clinical judgment –ALL have pitfalls/malfunctions/limitations –Is more complex than ever. EtCO 2 Monitoring.

E N D
EtCO2 Monitoring • “Snapshot in time” • Assists with patient assessment BUT: –Do NOT replace eyes-on/hands-on care –Are just one piece of clinical judgment –ALL have pitfalls/malfunctions/limitations –Is more complex than ever
EtCO2 Monitoring • Non-invasive method of determining Carbon Dioxide levels in intubated and non-intubated patients • Uses infra-red technology, to monitor exhaled breath to determine CO2 levels numerically and by waveform (capnogram).
EtCO2 Monitoring • EtCO2 is directly related to the ventilation status of the patient (as opposed to SAo2, which relates oxygenation of the patient) • Capnography can be used to verify endotracheal tube/Combi-Tube & King Airway placement and monitor its position, assess ventilation and treatments, and to evaluate resuscitative efforts during CPR
EtCO2 Monitoring • Review of Pulmonary Anatomy & Physiology • The primary function of the respiratory system is to exchange carbon dioxide for oxygen. • During inspiration, air enters the upper airway via the nose where it is warmed, filtered, and humidified • The inspired air flows through the trachea and bronchial tree to enter the pulmonary alveoli where the oxygen diffuses across the alveolar capillary membrane into the blood.
EtCO2 Monitoring Cellular Ventilation
EtCO2 Monitoring Alveolar Ventilation
EtCO2 Monitoring • Measurement methods • Single, one-point-in-time (Easy-Cap). • Electronic devices • Continuous information • Utilize infrared (IR) spectroscopy to measure the CO2 molecules’ absorption of IR light as the light passes through a gas sample.
EtCO2 Monitoring • Electronic Devices: • Mainstream • Located directly on the patient’s endotracheal tube • Sidestream • Remote from the patient. • Mainstream sampling • Occurs at the airway of an intubated patient • Was not originally intended for use on non-intubated patients. • Heavy and bulky adapter and sensor assemblies may make this method uncomfortable for non-intubated patients.
EtCO2 Monitoring • Sidestream sampling • Exhaled CO2 is aspirated (at 50ml/min) via ETT, cannula, or mask through a 5–10 foot long sampling tube connected to the instrument for analysis • Both mainstream and sidestream technologies calculate the CO2 value and waveform.
EtCO2 Monitoring • A new technology, Microstream, utilizes a modified sidestream sampling method, and employs a microbeam IR sensor that specifically isolates the CO2 waveform. • Microstream can be used on both intubated and non-intubated patients.
EtCO2 Monitoring • ContinuousEtCO2 monitoring = changes are immediately seen (CO2 diffuses across the capillary-alveolar membrane <½ second) • Sa02 monitoring is also continuous, but relies on trending. • - and - • The oxygen content in blood can maintain for several minutes after apnea (especially w/ pre-oxygenation)
EtCO2 Monitoring • Definitions • Tachypnea • Abnormally rapid respiration • Hyperventilation • Increased minute volume that results in lowered CO2 levels (hypocapnia) • Hypoventilation • Reduced rate & depth of breathing that causes an increase in carbon dioxide (hypercapnia)
EtCO2 Monitoring • EtCO2 Numerical Values (Ventilatory Assessment) • Normal = 35-45mmHg • < 35mmHg = Hyperventilation • Respiratory alkalosis • > 45mmHg = Hypoventilation • Respiratory acidosis
EtCO2 Monitoring • EtCO2 Numerical Values (Metabolic Assessment) • Normal = 35-45mmHg • < 35mmHg = Metabolic Acidosis • > 45mmHg = Metabolic Alkalosis • Dependant on 3 variables • CO2 production • Delivery of blood to lungs • Alveolar ventilation
EtCO2 Monitoring • Increased EtCO2 • Decreased CO2 clearance • Decreased central drive • Muscle weakness • Diffusion problems • Increased CO2 Production • Fever • Burns • Hyperthyroidism • Seizure • Bicarbonate Rx • ROSC • Release of tourniquet/Reperfusion
EtCO2 Monitoring • Decreased EtCO2 • Increased CO2 Clearance • Hyperventilation • Acidosis ( ↓HCO3 levels 2° to ↑ Hydrogen) • Decreased CO2 production • Hypothermia • Sedation • Paralysis • Decreased Delivery to Lungs • Decreased cardiac output • V/Q Mismatch • Ventilating non-perfused lungs (pulmonary edema)
EtCO2 Monitoring • Ventilation/Perfusion Ratio (V/Q) • Effective pulmonary gas exchange depends on balanced V/Q ratio • Alveolar Dead Space (atelectasis/pneumonia) (V > Q = CO2 content) • Shunting (blood bypasses alveoli w/o picking up o2) (V < Q = CO2 content) • 2 types of shunting: • Anatomical – blood moves from right to left heart w/o passing through lungs (congenital) • Physiological – blood shunts past alveoli w/o picking up o2
EtCO2 Monitoring • Ventilation/Perfusion Ratio (V/Q) • V/Q Mismatch • Inadequate ventilation, perfusion or both • 3 types • Physiological Shunt (V<Q) • Blood passes alveoli • Severe hypoxia w/ > 20% bypassed blood • Pneumonia, atalectasis, tumor, mucous plug • Alveolar Dead Space (V>Q) • Inadequate perfusion exists • Pulmonary Embolus, Cardiogenic shock, mechanical ventilation w/ tidal volumes • Silent Unit ( V & Q) • Both ventilation & perfusion are decreased • Pneumothorax & ARDS
EtCO2 Monitoring More Air Less Blood V > Q Equal Air and Blood V = Q More Blood Less Air V < Q
EtCO2 Monitoring • Components of the normal capnogram
EtCO2 Monitoring • A - B =respiratory baseline • CO2-free gas in the deadspace of the airways
EtCO2 Monitoring • B-C (expiratory upstroke) • Alveolar air mixes with dead space air
EtCO2 Monitoring • C-D (expiratory plateau) • Exhalation of mostly alveolar gas (should be straight) • Point D = measurement point (35-45mmHg)
EtCO2 Monitoring • D-E =inspiration • Inhalation of CO2-free gas
EtCO2 Monitoring • Changes in the capnogram or EtCO2 levels: • Changes in ventilation • Changes in metabolism • Changes in circulation • Equipment failure
EtCO2 Monitoring • EtCO2 in specific settings • Non-Intubated patients • Asthma & COPD • CHF/Pulmonary Edema • Pulmonary Embolus • Head Injury • Metabolic Illnesses
EtCO2 Monitoring • Asthma and COPD • Provides information on the ventilatory status of the patient • Combined with other assessments, can guide treatment
EtCO2 Monitoring • Asthma and COPD (Cont’d) • Shark fin waveform
EtCO2 Monitoring • Asthma and COPD (Cont’d) • Ventilatory assistance and/or intubation may be considered with severe dyspnea and respiratory acidosis (EtCO2 >50mmHg) • 18% of ventilated asthma patients suffer a tension pneumothorax • New ACLS standards recommend ETI for asthma patients who deteriorate despite aggressive treatment.
EtCO2 Monitoring • Emphysema
EtCO2 Monitoring • EtCO2 & CHF/Pulmonary Edema • Wave forms will be normal (there is no bronchospasm) • Values may be increased (hypoventilation) ordecreased (hyperventilation)
EtCO2 Monitoring • Pulmonary Embolus • “Normal” waveform but low numerical value (why?) • Look for other signs and symptoms
EtCO2 Monitoring • Pulmonary Embolus • Note near “normal” waveform, but angled C-D section (indicates alveolar dead space)
EtCO2 Monitoring Head Injury • EtC02 is very useful in monitoring intubated head- injured patients. • Hyperventilation = Hypocapnia = Cerebral Ischemia • Target EtC02 value of 35-38 mmHg
EtCO2 Monitoring • Hypothermia
EtCO2 Monitoring • Hyperventilation
EtCO2 Monitoring • Hypoventilation
EtCO2 Monitoring • EtCO2 in the Intubated Patient • Identifies esophageal intubations & accidental extubations (head/neck motion can cause ETT movement of 5 cm) • Waveforms/numerical values are absent or greatly diminished • Do not rely on capnography alone to assure intubation!
EtCO2 Monitoring • Tracheal –vs- Esophageal Intubation
EtCO2 Monitoring • Esophageal Intubation
EtCO2 Monitoring • Esophageal Intubation w/carbonated beverages
EtCO2 Monitoring • EtCO2 and cardiac output • Values <20mmHg = unsuccessful resuscitation • Low (20-30mmHg) = good CPR or recovering heart
EtCO2 Monitoring • EtCO2 and cardiac output • Sudden increase in value = ROSC Cardiac arrest survivors had an average ETCO2 of 18mmHg, 20 minutes into an arrest while non survivors averaged 6. In another study, survivors averaged 19, and non-survivors 5.
EtCO2 Monitoring EtCO2 and cardiac output Successful defibrillation = pulses & EtcO2
EtCO2 Monitoring EtCO2 and cardiac output Because ETCO2 measures cardiac output, rescuer fatigue during CPR will show up as decreasing ETCO2. Change in rescuers – Note values w/ non-fatigued compressor