Download
1 / 22
220 likes | 268 Vues
Explore the typical characteristics of ocean water, from global statistics to vertical structures like thermoclines. Learn about sea surface properties and the distribution of temperature and salinity. Discover how zonal and meridional variations impact ocean conditions. Delve into the stability of water density and the vertical profiles of temperature and salinity. Gain insights into the role of salinity as a "passive tracer" in ocean currents.

E N D
Typical Distributions of Water Characteristics in the Oceans
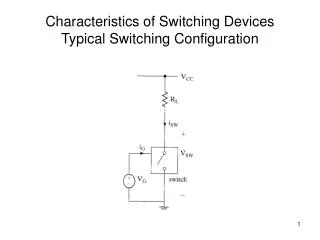
Ocean Mean State Sea Surface Properties Vertical Structure Thermocline
Global Statistics • The mean temperature of the world ocean is 3.5oC and the mean salinity is 34.7. (Even at the equator the average temperature is as low as 4.9°C). • 75% of the total volume of the ocean water has properties within the range from 0o to 6oC in temperature and 34 to 35 in salinity. • 50% of the total volume of the oceans has properties between 1.3oC and 3.8oC and between 34.6 and 34.8. • Both temperature and salinity are quite uniformly distributed below 1000 m depth. Volumetric temperature-salinity diagram of the world ocean. 75% of the ocean's water have a temperature and salinity within the green region, 99% have a temperature and salinity within the region colored in cyan. The warm water outside the 75% region is confined to the upper 1000 m of the ocean. From M. Tomczak, 1996: Introduction to Physical Oceanography (http://gaea.es.flinders.edu.au/~mattom/IntroOc)
Terms • Some water properties have a distinct tendency to be zonal (i.e., change in east-west direction is much smaller than in north-south) • An ocean area is usually referred in terms of its north-south position • Equatorial: the zonal within several degrees of the equator • Tropical: zones within the tropics (within 23o latitudes of the equator, usually refer to the processes extending outside the equatorial zone) • Low latitude: equatorial + tropical • Subtropical: higher-latitude sides of tropical zones (~20o-30o) • Temperate zones: between 30o-60o latitude bands (with most marked seasonal changes) • Mid-latitudes: subtropical and temperate zones • Polar: Arctic and Antarctic regions • Subpolar: the region between the strictly polar conditions and those of the temperate mid-latitudes • High latitudes: near poles (~ polar+subpolar)
Mean Sea Surface Temperature (SST) • roughly zonal (east-west) isotherm • meridional gradient follows solar radiation • diverted north-south near the eastern coast (cold tongues) southward of 40o latitudes •cooler water on the west basin northward 40oN • warm pool: SST > 28oC • sea ice at high latitudes (about -1.8oC) CPC Analysis, January 1982-December 2001
NODC WOA98, Levitus et al Mean Sea Surface Salinity (SSS) • SSS distribution is mostly zonal (range: 33-37) • Minimum north of the equator (ITCZ) • Maximum in subtropics (trade winds) • Lower around coast (river) and polar region (melting ice) • Mediterranean, 39 and Red Sea, 41 (large evaporation )
SSS distribution in open ocean is closely linked to precipitation and sea surface evaporation From Pickard and Emery: Descriptive Physical Oceanography: An Introduction
Surface density (t) t, 22 at equator, 26-27, 50o-60o latitude, decreases slightly further poleward t is affected by both the T and S distribution The temperature influence is more dominant
Temperature profiles • In many ocean regions, temperature decreases with depth, results in an increase of density with depth and produces a stable density stratification. • Vertically, there is an upper zone (mixed layer + thermocline) and a deep zone (with little change). • Mixed layer: depth 50-200 m. Temperature is close to SST. • Permanent thermocline: depth 200-1000 m, temperature changes rapidly with depth. It is located at 150 - 400 m depth in the tropics and at 400 - 1000 m depth in the subtropics and mid-latitudes. The temperature range is 8 - 15°C in mid-latitudes. • Subtropical: surface (20oC), 500 m (8oC), 1000m (5oC), 4000m (1-2oC) (From Pickard and Emery: Descriptive Physical Oceanography: An Introduction)
Salinity Profiles • Salinity increases at 100-200 m in the tropics (sinking heavy waters and flowing equatorward) • High latitude Atlantic: salinity increases with depth to 2000 m. • Pacific: salinity increases to deep ocean • At low and mid-latitudes, salinity decreases vertically and shows intermediate minima at 600 to 1000 m and then increases to 2000 m. They are linked with water mass formation at the sub-polar regions in northwestern Pacific and Atlantic, as well as between the Antarctic and South America. At very great depth, salinity increases again because the water near the ocean bottom originates from polar regions where it sinks during the winter; freezing during the process increases its salinity. • A decrease in salinity produces a density decrease. Taken on its own, the salinity stratification would therefore produce an unstable density stratification. In the ocean the effect of the temperature decrease is stronger than the effect of the salinity decrease, so the ocean is stably stratified. Salinity acts as a “passive tracer” indicating the flow directions of water masses by their salinity signatures (minima or maxima) • In the deep water, 4000m or deeper, the salinity is relatively uniform at 34.6 to 34.9 throughout the world ocean. The deeper-water temperature also has a small range (-0.9o to 2oC). This means that deep-water environment is very uniform in character. (From Pickard and Emery: Descriptive Physical Oceanography: An Introduction)
subsurface density and pycnocline Density increases with depth (The gradient is not uniform) In the tropics, there is a shallow upper layer of nearly uniform density, then a layer where density increases rapidly (pycnocline), below this the density increases slowly in the deep zone. In deep water t is about 27.9 (with little change with latitude). In high latitudes, surface t rise to 27 or more. There is a much smaller increase of density with depth than in low latitudes and the pycnocline is less evident.
Mixed layer • In a zone beneath the sea surface, properties are very well mixed vertically, particularly at the end of the night (diurnal cycle) and in winter (seasonal cycle). It is referred to as the mixed layer. • The layer is mixed by wind (<150m) and surface cooling (can be as deep as 1000m). • Re-stratified by surface warming, precipitation and adjacent mixed waters. • Functional definition: depth at which the water is 0.125 denser than the sigma-theta at the sea surface.
Kara, A. B., P. A. Rochford, and H. E. Hurlburt, 2003: Mixed layer depth variability over the global ocean. J. Geophys. Res., 108, doi:10.1029/2000C000736.
Kara, A. B., P. A. Rochford, and H. E. Hurlburt, 2003: Mixed layer depth variability over the global ocean. J. Geophys. Res., 108, doi:10.1029/2000C000736.
Thermocline • The region of higher vertical temperature gradient below the surface layer and above the abyssal layer is called the thermocline. • In low and mid latitudes, a main or permanent thermocline exists all the time at depths between 200 and 1000 m. • There is no permanent thermocline in polar and sub-polar waters (but usually a permanent “halocline” and associated “pycnocline”) • The thermocline water is given the water mass name “Central Water”
Ocean Stratification Potential density () as a function of latitude and depth in the Pacific Ocean. Note the scale difference between the depths about and below the upper 1000m. The density is quite uniformity below 1000 m depth in the range of 27.50-28.00.
Temperature and Salinity Distributions Temperature (top) and salinity (bottom) as functions of latitude and depth in the Pacific Ocean. (The image includes the Arctic Ocean on the extreme right.) Note the uniformity of both properties below 1000 m depth; the temperature is in the range 0 - 4°C, the salinity is near 34.6 - 34.7.
Temperature and Salinity Distributions Enlarged T(top) and S(bottom) sections in the upper 1500 m of the Pacific Ocean. The highest temperature in the tropics is above 28°C. The permanent thermocline is the depth range of rapid temperature change, which in the tropics is found at 150 - 600 m. Salinity also displays large changes in the upper 500 m, mainly in response to the precipitation - evaporation balance. In the depth range 800 - 1500 m the salinity is rather uniform at about 34.5 over most of the Pacific Ocean.
Equatorial Thermocline Note the high vertical temperature gradient around 20oC isotherm.
Note the high vertical temperature gradient around 20oC isotherm.
Mean 20oC isotherm (unit: meter) Climatology from ocean data assimilation (1958-1998) The thermocline zone is sometimes characterized by the depth at which the temperature gradient is a maximum (the “thermocline depth”).In the low-latitude ocean, 20oC isotherm is a good indicator of the themocline location.The maxima of the 20oC isotherm (the major warm waters in the upper ocean) are located differently from those of SST (The former is mainly determined by ocean dynamics while the latter by surface heat flux)
High value close to surface Oxygen minimum in tropics (possibly related to high static stability) high value in North Atlantic and tropical Atlantic below 1000m Low value in North Pacific (water away from surface a long time, deep circulation slow) Similar distributions in Southern Oceans Low values of dissolved oxygen in the sea may often be taken to indicate that the water has been away from the surface for a long time, the oxygen having been deleted by the biological demands and oxidation of detritus. (dissolved oxygen is a non-conservative quantity.)