Download

1 / 26
440 likes | 889 Vues
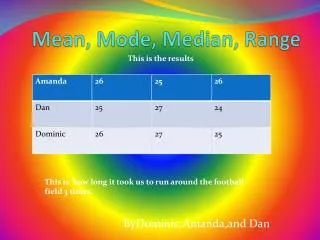
Mean, Median, Mode, Range & Stem and Leaf Plots. Measures of Central Tendency. Mean. The mean is the Average of a group of numbers It is helpful to know the mean because then you can see which numbers are above and below the mean. Mean Example. Here is an example test scores for

E N D
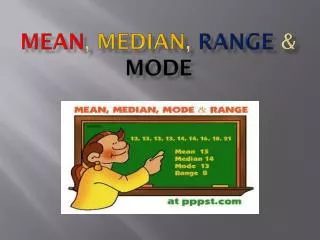
Mean, Median, Mode, Range & Stem and Leaf Plots Measures of Central Tendency
Mean • The mean is the Average of a group of numbers • It is helpful to know the mean because then you can see which numbers are above and below the mean
Mean Example Here is an example test scores for Ms. Math’s class. 82 93 86 97 82 To find the Mean, first you must add up all of the numbers. 82+93+86+97+82= 440 Now, since there are 5 test scores, we will next divide the sum by 5. 440÷5= 88 The Mean is 88!
Another Mean Example Here is an example test scores for your math class. 72 93 86 97 x – test you haven’t taken yet What if you wanted to get at an 85 in your math class for your final grade. What is the lowest you can make on the test you haven’t taken yet? How would you figure it out? Let’s see if we write and solve this out. X = 77
Median • The Median is the middle value on the list. • The first step is always to put the numbers in order from least to greatest.
Median Example • First, let’s examine these five test scores. 78 93 86 97 79 We need to put them in order. 78 79 86 93 97 The number in the middle is 86 78 79 86 93 97 In this case, the Median is 86!
Median Example #2 Now, let’s try it with an even number of test scores. 9286 94 83 72 88 First, we will put them in order 72 83 86 88 92 94 This time, there are two numbers in the middle, 86and88 72 83 86 88 92 94 Now we will need to find the Average of these two numbers, by adding them and dividing by two. 86+88= 174 174÷2= 87 Here the Median is 87
Mode • The Mode refers to the number that occurs the most frequently. • It’s easy to remember… the first two numbers are the same! MOde and MOst Frequently!
Mode Example • Here is an list of temperatures for one week. Mon. Tues. Wed. Thurs. Fri. Sat. Sun. 77° 79° 83° 77° 83° 77° 82° Again, We will put them in order. 77° 77° 77° 79° 82° 83° 83° 77° is the most frequent number, so the mode= 77°
Range • The range is the difference between the highest and the lowest numbers of the series. • All we have to do is find the highest number and the lowest number and subtract!
Range Example • Let’s look at the temperatures again. 77° 77° 77° 79° 82° 83° 83° The highest number is 83, and the lowest is 77. All you need to do is subtract! 83-77= 6 In this case, the Range is6
Stem and Leaf Plots • This a way to display data in an organized manner. 0 2 4 5 1 3 6 7 8 8 2 0 2 3 7 9 What numbers does this stem and leaf plot represent?
Stem and Leaf Plots • Can you find the mean, median, mode, and range of the stem and leaf plot? 0 2 4 5 1 3 6 7 8 8 2 0 2 3 7 9 Stem and Leaf Plot Numbers: 2, 4, 5, 13, 16, 17, 18, 18, 20, 22, 23, 27, 29
Now YOU try it!!! This is the AVERAGE Family! Dad Mom Jack Alex Katie 34 33 5 4 1
The Average Family Dad Mom Jack Alex Katie34 33 5 4 1 Make a stem and leaf plot of the family’s ages.
Mean Here are the ages again… Dad- 34, Mom- 33, Jack- 5, Alex- 4, Katie- 1 What is the Mean? Remember… Mean is the AVERAGE
Mean Remember, to find the mean, we have to first add up all of the numbers. 34+33+5+4+1= 77 Then, since there are 5 people in the family, we next divide by 5. 77÷5= 15.4 The Mean in this case is 15.4
Median Here are the ages again… Dad- 34, Mom- 33, Jack- 5, Alex- 4, Katie- 1 What is the Median? Remember… Median is the MIDDLE NUMBER
Median Remember, to find the mean, we have to first put all of the numbers in order. 34 33 5 4 1 The Mean in this case is 5
Mode Here are the ages again… Dad- 34, Mom- 33, Jack- 5, Alex- 4, Katie- 1 What is the Mode? Remember… Mode is the MOST FREQUENT
Mode Remember, to find the mode, we have to first put all of the numbers in order. 34 33 5 4 1 The Mode, in this case, does not exist. Since there is not a number that appears most often, you write no mode.
Range Here are the ages again… Dad- 34, Mom- 33, Jack- 5, Alex- 4, Katie- 1 What is the Range? Remember… Range is the DIFFERENCE
Range Remember, to find the range, we have to first put all of the numbers in order. 34 33 5 4 1 The highest age is 34, and the lowest is 1 Now we need to subtract to find the difference 34-1= 33 The range is 33
Now let’s see how you do on yesterday and today’s concepts… Pg. 62 & 63 2-22, 30-34 evens only AND Pg. 121 6, 8, 20-22, 25 all problems