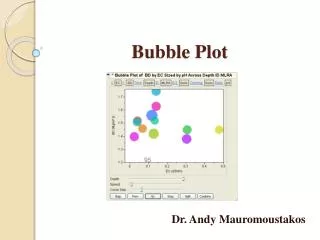
Geometry Bootcamp Mean, Median, Mode, & Range Stem-&-Leaf Plot Box Plot
Geometry Bootcamp Mean, Median, Mode, & Range Stem-&-Leaf Plot Box Plot. 8- (16, 17). Warm-Up (5 min). Give the Quadrant and Graph the coordinates: (-1,2) (7, 1.5) (-4, -3) (-2, ). Y. X. Mean, Median, Mode and Range. The Basics of Statistics. Did You Know….


Geometry Bootcamp Mean, Median, Mode, & Range Stem-&-Leaf Plot Box Plot
E N D
Presentation Transcript
Geometry BootcampMean, Median, Mode, & RangeStem-&-Leaf PlotBox Plot 8- (16, 17)
Warm-Up (5 min) • Give the Quadrant and Graph the coordinates: • (-1,2) • (7, 1.5) • (-4, -3) • (-2, ) Y X
Mean, Median, Mode and Range The Basics of Statistics
Did You Know… That you probably use Statistics such as Mean, Median, Mode and Range almost every day without even realizing it?!?
Today We Will Learn… • Mean • Median • Mode • Range • And how to use these in everyday life, as well as the classroom!
To Help You Learn… • You should have a Pencil, a Piece of Paper, and a Calculator if you need one.
What Do We Already Know? Sure, the words “Mean, Median, Mode and Range” all sound confusing… But what about the words we already know, like Average, Middle, Most Frequent, and Difference? They are all the same ideas!
Mean • The mean is the Average of a group of numbers • It is helpful to know the mean because then you can see which numbers are above and below the mean • It is very easy to find!
Mean Example Here is an example test scores for Ms. Math’s class. 82 93 86 97 82 To find the Mean, first you must add up all of the numbers. 82+93+86+97+82= 433 Now, since there are 5 test scores, we will next divide the sum by 5. 440÷5= 88 The Mean is 88!
Median • The Median is the middle value on the list. • The first step is always to put the numbers in order.
Median Example • First, let’s examine these five test scores. 78 93 86 97 79 We need to put them in order. 78 79 86 93 97 The number in the middle is 86 78 79 86 93 97 In this case, the Median is 86!
Median Example #2 Now, let’s try it with an even number of test scores. 92 86 94 83 72 88 First, we will put them in order 72 83 86 88 92 94 This time, there are two numbers in the middle, 86 and 88 72 83 86 88 92 94 Now we will need to find the Average of these two numbers, by adding them and dividing by two. 86+88= 174 174÷2= 87 Here the Median is 87
Mode • The Mode refers to the number that occurs the most frequently. • It’s easy to remember… the first two numbers are the same! MOde and MOst Frequently!
Mode Example • Here is an list of temperatures for one week. Mon. Tues. Wed. Thurs. Fri. Sat. Sun. 77° 79° 83° 77° 83° 77° 82° Again, We will put them in order. 77° 77° 77° 79° 82° 83° 83° 77° is the most frequent number, so the mode= 77°
Range • The range is the difference between the highest and the lowest numbers of the series. • All we have to do is put the numbers in order and subtract!
Range Example • Let’s look at the temperatures again. 77° 77° 77° 79° 82° 83° 83° The highest number is 83, and the lowest is 77. All you need to do is subtract! 83-77= 6 In this case, the Range is 6
Now YOU try it!!! This is the Stat Family! Dad Mom Jack Alex Katie 34 33 5 5 1
Mean Here are the ages again… Dad- 34, Mom- 33, Jack- 5, Alex- 5, Katie- 1 What is the Mean? Remember… Mean is the AVERAGE Try it on your paper and see what you come up with!
Mean Remember, to find the mean, we have to first add up all of the numbers. 34+33+5+5+1= 80 Then, since there are 6 people in the family, we next divide by 6. 78÷6= 13 The Mean in this case is 13
Median Here are the ages again… Dad- 34, Mom- 33, Jack- 5, Alex- 5, Katie- 1 What is the Median? Remember… Median is the MIDDLE NUMBER Try it on your paper and see what you come up with!
Median Remember, to find the mean, we have to first put all of the numbers in order. 34 33 5 5 1 The Mean in this case is 5
Mode Here are the ages again… Dad- 34, Mom- 33, Jack- 5, Alex- 5, Katie- 1 What is the Mode? Remember… Mode is the MOST FREQUENT Try it on your paper and see what you come up with!
Mode Remember, to find the mode, we have to first put all of the numbers in order. 34 33 5 5 1 The Mode in this case is 5
Range Here are the ages again… Dad- 34, Mom- 33, Jack- 5, Alex- 5, Katie- 1 What is the Range? Remember… Range is the DIFFERENCE Try it on your paper and see what you come up with!
Range Remember, to find the range, we have to first put all of the numbers in order. 34 33 5 5 1 The highest age is 34, and the lowest is 1 Now we need to subtract to find the difference 34-1= 33 The range is 33
To practice more, or to go for more help, then try some of these websites! http://www.bbc.co.uk/schools/revisewise/maths/data/12_act.shtml http://www.mathgoodies.com/lessons/toc_vol8.shtm http://math.about.com/library/weekly/aa020502a.htm
Displaying & Analyzing Data Stem-and-leaf Plot Box-and-Whisker Plot
Statistics: Stem-and-Leaf Plots • Statistics: The branch of mathematics that deals with collecting, organizing, analyzing or interpreting data. • Data: Numerical facts or information. • Stem-and-Leaf Plots: A convenient method to display every piece of data by showing the digits of each number.
Statistics: Stem-and-Leaf Plots • In a stem-and-leaf plot, the greatest common place value of the data is used to form stems. • The numbers in the next greatest place value position are then used to form the leaves.
Age of United states Presidents at their First Inauguration: 57 61 57 57 58 57 61 54 68 51 49 64 50 48 65 52 56 46 54 49 50 47 55 54 42 51 56 55 51 54 51 60 62 43 55 56 61 52 69 64 (Through the 40th presidency) Stem Leaf 9 8 6 9 7 2 3 4 5 6 7 7 7 8 7 4 1 0 2 6 4 0 5 4 1 6 5 1 4 1 5 6 2 1 1 8 4 5 0 2 1 9 4
Statistics: Stem-and-Leaf Plots Age of United states Presidents at their First Inauguration: 57 61 57 57 58 57 61 54 68 51 49 64 50 48 65 52 56 46 54 49 50 47 55 54 42 51 56 55 51 54 51 60 62 43 55 56 61 52 69 64 (Through the 40th presidency) Rearrange the leaf in numerical order from least to greatest Stem Leaf 4 5 6 2 3 6 7 8 9 9 0 0 1 1 1 1 2 2 4 4 4 4 5 5 5 6 6 6 7 7 7 7 8 0 1 1 1 2 4 4 5 8 9
Statistics: Stem-and-Leaf Plots • It is easy to interpret or analyze information from the Stem-and-Leaf. • How many presidents were 51 years old at their inauguration? • What age is the youngest president to be inaugurated? • What is the age of the oldest president to be inaugurated? • How many presidents were 40-49 years old at their inauguration? 4 42 69 7 Leaf: Age of United States Presidents at their First Inauguration (through the 40th Presidency) Stem 4 5 6 2 3 6 7 8 9 9 0 0 1 1 1 1 2 2 4 4 4 4 5 5 5 6 6 6 7 7 7 7 8 0 1 1 1 2 4 4 5 8 9
Data Displays A box-and-whisker plot shows how data is distributed by using the median, upper and lower quartiles, and the greatest and least values in the data set.
17, 18, 19, 21, 24,26, 27 The lower quartile (LQ) is the median of the lower half of the data. The LQ is 18. The upper quartile (UQ) is the median of the upper half of the data. The UQ is 26. ___ __ 16 17 18 19 20 21 22 23 24 25 26 27 28
Make a Box & Whisker Plot 76, 78, 82, 87, 88, 88, 89, 90, 91, 95 88 Find the median of this segment (LQ) Find the median of this segment. LQ = 82 UQ = 90
Lower Quartile (LQ) Middle Quartile Least Value Upper Quartile Greatest Value 76, 78, 82, 87, 88, 88, 89, 90, 91, 95 75 80 85 70 105 90 100 95 65 Now for the box and whisker
Lower Quartile (LQ) Middle Quartile Least Value Upper Quartile Greatest Value 76, 78, 82, 87, 88, 88, 89, 90, 91, 95 75 80 85 70 105 90 100 95 65 What number represents 25% of the data? LQ 82 What number represents 50% of the data? Median 88 What number represents 75% of the data? UQ 90
If Absent: See me about two other work sheets that will not insert here. Classwork: We will have Three Stations as you can see: Mean, Median, Mode, & Range Stem & Leaf Plot Box Plot Visit the stations that you think you the most clarity on first. Each Station has the Powerpoint for examples. The worksheets are due at the end of class
Stem and Leaf Plot • Stem and leaf plots are used as a quick way of seeing how many pieces of data fall in various ranges. The reader can quickly tell: - the range - the mode • Stem and leaf plots have a title, a stem, and leaves • A key is used to explain how to read the stem and leaves.
Displays large set of data. Gives general idea of how data clusters. Graph includes: - Title - Labeled intervals - Box between lower and upper quartiles - Whiskers from quartiles to extremes - Median, quartiles and whiskers labeled Box - and - Whisker Plot