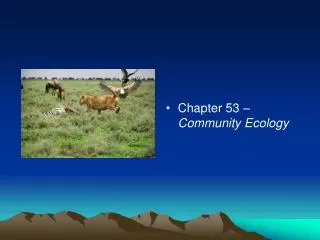
Chapter 53 Population Ecology
Chapter 53 Population Ecology. 53.1 Dynamic biological processes influence population density, dispersion, and demographics. Population. Population- a group of individuals of a single species living in the same general area Three fundamental characteristics of a population Density Dispersion


Chapter 53 Population Ecology
E N D
Presentation Transcript
53.1 Dynamic biological processes influence population density, dispersion, and demographics
Population • Population- a group of individuals of a single species living in the same general area • Three fundamental characteristics of a population • Density • Dispersion • Demographics
Density and Dispersion • Scientists have begun investigating the boundaries of a population. • They may be natural or arbitrarily defined • Density – the number of individuals per unit area or volume • Dispersion – the pattern of spacing among individuals within the boundaries of the population
Density • Almost impossible to actually count the number of individuals • Some ecologists will estimate and extrapolate • Mark-Recapture method • Density is not a static property • Immigration- the movement of organisms into an area • Emigration- the movement of organisms out of the area
Patterns of Dispersion • Clumped – sea stars grouping together where food is abundant • Uniform – penguins maintaining almost equal spacing due to aggressive interactions between neighbors • Random – dandelions growing wherever the seeds land and germinate
(a) Clumped (b) Uniform (c) Random
Demographics • Demography – the study of vital statistics of populations and how they change over time • Life tables • Survivorship curves
Life Tables • Age-specific summaries of the survival pattern of a population • Best way to construct one is to follow the fate of a cohort from birth until death • A group of individuals of the same age
Survivorship Curves • A graphing method of representing the data in a life table • Three different types of patterns • Type I- flat to start then drops steeply • Humans and other mammals • Type II – steady decline • Squirrels • Type III – drops sharply at the start • Oysters
Survivorship Curves 1,000 I 100 II Number of survivors (log scale) 10 III 1 0 50 100 Percentage of maximum life span
Reproductive Rates • Demographers typically ignore males and focus on females • A reproductive table (fertility schedule) is an age specific summary of the reproductive rates in a population. • Tallies the number of female offspring produced by each age group
Natural selection favors traits of organisms that allow them to survive longer and reproduce • Life history- the trait that affects an organism’s schedule of reproduction and survival • Start of reproduction • How often reproduction occurs • Amount of offspring per reproduction cycle
Evolution and Life History Diversity • One-shot reproduction • Semelparity- one big reproduction of offspring (big bang reproduction) • Iteroparity- offspring over many years • 2 critical factors: • Survival rate of offspring • Likelihood hood that adults will live to reproduce again
Evolution and Life History Diversity • Semelparity if offspring aren’t likely to survive long • Iteroparity if the environment is favorable to the adults
“Trade-offs” and Life Histories • Natural selection cannot maximize all reproduction variables simultaneously • Time, energy, and nutrients limit reproduction of organisms • Trade-offs between survival and reproduction • Selective pressures between number of offspring and size of offspring • Parent care and learn through 1st year makes an impact
53.3- The Exponential Model Describes Population Growth in an Idealized, Unlimited Environment
Potential to expand if resources are right • Reveals capacity of species for increase and conditions under which capacity may be expressed
Per Capita Rate of Increase • Population will increase with births and emigrations • Populations will decrease with deaths and immigration • Change in population= (birth + immigration) – (deaths + emigrations)
Per Capita Rate of Increase • Per capita birth rate- number of offspring produced by an average member of the population • Per capita death rate- expected number of deaths per a unity of time • Most interested in the difference between the death and birth rates
Per Capita Rate of Increase • R=b-d • R is the indication whether a given population is growing or declining • Zero population growth (ZPG) the birth and death rates equal zero
Exponential Growth • Exponential population growth- population increase under ideal conditions • J-shaped curved • Can mean the introduction to a new environment • Numbers that have been affected by a catastropic event
53.4 The logistic model describes how a population grows more slowly as it nears its carry capacity
Exponential growth model assumes that resources are unlimited • Not the case in the real world • Carrying capacity (K) – the maximum population size that a particular environment can sustain
The Logistic Growth Model • The per capita rate of increase approaches zero as the carrying capacity is reached • Will produce an s-shaped curve
Exponential growth 2,000 dN 1.0N = dt 1,500 K = 1,500 Population size (N) Logistic growth 1,000 1,500 – N dN 1.0N = 1,500 dt 500 0 0 5 10 15 Number of generations
180 1,000 150 800 120 Number of Paramecium/mL Number of Daphnia/50 mL 600 90 400 60 200 30 0 0 0 5 10 15 0 20 40 60 80 100 120 140 160 Time (days) Time (days) (a) A Paramecium population in the lab (b) A Daphnia population in the lab
Logistic Model and Real Populations • The logistic model assumes that populations will adjust instantaneously • This is not typically the case • This will cause a population to temporarily overshoot the carrying capacity • Allee effect- individuals may have a more difficult time surviving or reproducing if the population size is too small
Logistic Model and Life Histories • K-selection- density dependent • Operates in populations living at a density near their carrying capacity • R-selection- density independent • Traits that maximize reproductive success in uncrowded environments
53.5 Many factors that regulate population growth are density dependent
Population Change and Population Density • Density independent populations will have birth and death rates that will not change with density • Density dependent populations will have birth and death rates that will rise and fall with density
Density-Dependent Population Regulation • Without some type of negative feedback between population density and the rates of birth and death, a population will never stop growing. • Competition for resources • Increasing population density competing for declining nutrients will lead to a lower birth rate • Toxic Wastes • The accumulation of toxic waste can effect population size • Intrinsic Factors • In some cases the physiological factors rather than the environmental factors will influence the population size
Continued • Territoriality • Territory spaces becomes a resource in which individuals compete for. • Disease • If the transmission rate of a certain disease depends on the crowding in a population, density will be effected • Predation • A predator encounters and captures more food as the density of the prey increases
Territoriality (a) Cheetah marking its territory (b) Gannets
Predation 2,500 50 Wolves Moose 2,000 40 30 1,500 Number of wolves Number of moose 20 1,000 10 500 0 0 1955 1965 1975 1985 1995 2005 Year
Population Dynamics • Focuses on the complex interactions between the biotic and abiotic factors that cause variation in the size of populations • Populations of large mammals were once thought to remain stable over time, this is not the case
Immigration, Emigration, and Metapopulations • Immigration and emigration can also affect populations • Metapopulation- a group of spatially separated populations of one species that interact through immigration and emigration • Local populations can be thought of as occupying small patches of suitable environment within a sea of unsuitable habitat • Patches will vary in size, quality, and isolation from other patches • There are many factors that will influence how patches interact
54.1 Community interactions are classified by whether they help, harm, or have no effect on the species involved
Competition • Interspecific competition – has a negative effect on the survival and reproduction of the predator population and a negative effect on that of the prey population. • Occurs when individuals of different species compete for a resource that limits their growth and survival. • ie. Weeds compete from soil nutrients and water. Grasshoppers vs. bison for grass they both eat.
Competition: Competitive Exclusion • Two species competing for the same limiting resources cannot coexist in the same place. • Without disturbances, one species will use the resource more efficiently and reproduce more rapidly than the other. • The slight reproductive advantage will eventually lead to local elimination of the inferior competitor. • This is called competitive exclusion.
Competition: Ecological Niches • Ecological niche – the sum of a species’ use of the biotic and abiotic resources in its environment. • An organism’s niche is its ecological role , how it “fits into” an ecosystem. • Two species cannot coexist permanently in a community if their niches are identical. • However, ecologically similar species can coexist in a community if there are more significant differences in their niches. Resource partitioning – the differentiation of niches that enables similar species to coexist in a community.
Competition: Ecological Niches • A species’ fundamental niche (the niche potentially occupied by that species) is often different from its realized niche (portion of its fundamental niche that it actually occupies). • The fundamental niche of a species can be identified by testing the range of conditions in which it grows and reproduces without competitors. • Also test if a potential competitor limits a species’ realized niche by removing the competitor and seeing if the first species going into the newly available space.
Competition: Character Displacement • Allopatric – geographically separate • Sympatric – geographically overlapping • In some cases, the allopatric populations of species are morphologically similar and use similar resources. • In contrast, sympatric populations show differences in body structures and in the resources they use. • This tendency for characteristics to diverge more in sympatric populations of two species is character displacement.
Predation • A positive predator population survival and reproduction activity with negative prey population survival and reproduction activity. • Both predators and prey have adaptations that help eat, and help avoid being eaten such as claws, teeth, heat sensing organs, and poison while prey can hide, alert, flee, or form herds/schools.
Predation • Animals display a variety of morpholocial and physiological defensive adaptations. • Cryptic coloration (camouflage) – makes prey difficult to spot • Aposematic coloration (warning) – animals with effective chemical defenses often show this. • Batesian mimicry – a palatable or harmless species mimics a harmful model. • Mullerian mimicry – two or more unpalatable species resemble each other. Each species gains and additional advantage because the more unpalatable prey they are, the more quickly avoid them as prey.