Download
1 / 68
680 likes | 866 Vues
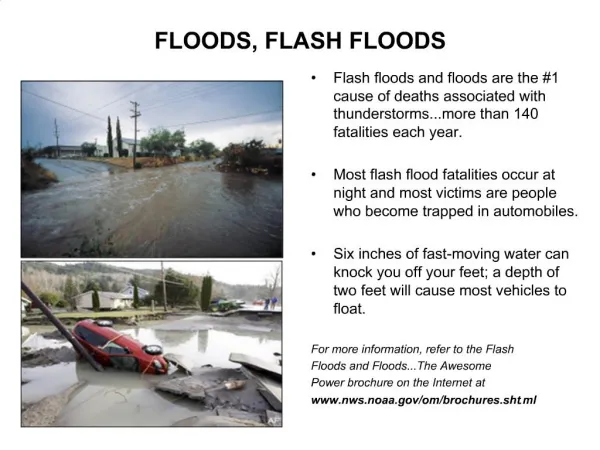
Nowcasting Flash Floods and Heavy Precipitation --- A Satellite Perspective. --------------------------------------------- Jim Gurka National Weather Service Office of Meteorology Silver Spring, MD james.gurka@noaa.gov 301-713-1970. Satmet 99-2 Wednesday, 28 April 1999.

E N D
Nowcasting Flash Floods andHeavy Precipitation ---A Satellite Perspective --------------------------------------------- Jim Gurka National Weather Service Office of Meteorology Silver Spring, MD james.gurka@noaa.gov 301-713-1970 Satmet 99-2Wednesday, 28 April 1999
Satellite Pictures GOES Water Vapor (6.7 mm) day and night): detects moisture and weather systems between 700 - 300 mb GOES Infrared (10.5 - 12.6 mm) day and night): detects cloud top temperature and surface temperature GOES Visible (0.55 - 0.75 mm) (day only): what you can see: clouds, water, land
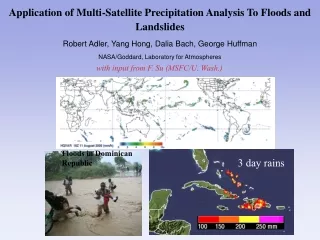
Satellite Pictures Polar Microwave (SSM/I and AMSU): detects precipitation, moisture, snow cover, ocean surface winds, surface wetness
Quantitative Precipitation Forecasts (QPF) The prediction of how much precipitation (e.g., 1/2 inch, 1 inch, 2 inches, etc) will fall during a specified period of time (e.g., 3 hours, 6 hours, 12 hours, 24 hours, etc)
Quantitative Precipitation Forecasts (QPF) Assimilation Analysis Anticipation Intuition Experience
NCEP EMC HPC SPC TPC MPC CPC AWC SEC
Forecasting Pcpn Amounts from NWP Models Data Assimilation Sfc, Upr Air; Satellite; Radar/Profilers; ACARS Into NWP Models Gives an approximate solution to wind, temperature & moisture fields in the atmosphere; QPF: Serves as guidance to how much precipitation will occur
NWP Model Output vs Observations 24 hours before a pcpn event: Model output is about 17x more useful than data; At time zero: Model output has virtually no value compared to observations; 9 hours before an event: Obs and model output have about equal value;
QPF: 2 Problems Interpreting the Numerical Guidance; Knowing a big rainfall event from a small one (in terms of scale and intensity)
Why Models Have Forecast Problems Lack of data over oceans/Mexico Sparse upper air obs: lose details Initialization and QC…smooth data fields Smoothed terrain Atmospheric process are non-linear Model Physics are approximations
HPC Tips for Doing a QPF Look at precipitation history; System evolution; Basic ingredients & trends Gridded data…be careful compare models for continuity and known biases Consider local effects; Watch out for High Bias; Verification Warm Season: lower expectations Call NCEP for guidance/empathy 301-763-8343
QPF Improved with Resolution and Data Assimilation Meso-Eta, Cool Season: Performance better in cool season Resolves intense thermal gradients Meso-Eta, Warm Season A problem with MCS in the prediction of outlow boundaries Meso-Eta over High Terrain low bias due to model resolution (32 km) Betts Scheme needs adjustment for shallow conv. RUC: 3 hour pcpn forecasts more accurate than from Eta
Model Resolution AVN: 110 km / 28 layers NGM: 80 km / 16 layers RUC: 60 km / 26 layers Early Eta: 48 km / 38 layers Meso-Eta: 32 km / 45 layers Meso-Eta: 17 layers below 850 mb vs. NGM: 3 layers
Data Assimilation: Goals Reduce “spin up” problem Improve model QPF Improve soil moisture initialization Include mesoscale information found in precipitation data
Pattern Recognition Heavy rainfall events can often be identified with particular patterns Patterns are identified by: conventional data model output satellite data radar
Pattern Recognition Thickness patterns 70% saturation thickness Preferred thickness
Rules of Thumb for Hvy Rain Max: Strongest inflow + Boundary Max: Just NE of Theta-E Ridge Along outflow S of Wmfnt (summer) Inverted isobars along a front MCS track alng or Rt of K lines Convection Srn edge of Westerlies MCSs often form near upr ridge
Rules of Thumb for Hvy Rain Beware slow moving synoptic systems (SHARS) …often have warm tops MCSs often form near upr ridge Strong hgt falls / fast movg systems usually preclude very heavy rafl Models usually predict axis of heaviest rain too far north (outflows)
Rules of Thumb for Hvy Rain K index: good measure of deep moisture beware Ks in upper 30s Tropical Systems Max rainfall usually in core at night usually along periphery in daytime
To Release CAPE: Syn scale forcing does not act quickly enough (but moistens air & wkns cap) Need meso source of lift to reach LFC low level boundaries/ fronts find boundaries in T, DP, Theta-E & wind low level convergence
Importance of CIN Steep lapse rate above inversion classic loaded gun sounding Cap stores energy leading to higher potential buoyant energy later in the day or evening Slightly stronger CIN upstream can sometimes lead to backbuilding
Eta Characteristics Most srn bias for cyclone track esp east of Appalachians Too slow and too far west with strng surface cyclones coming up East coast Sometimes overdevelops LLJ Too much Pcpn Gulf and Atl coasts due to diff in convective parameterization Vort centers too strong (with convct)
Eta Characteristics Significantly underforecasts monsoonal convct over SW states Best at fcstg frntl psn (using LI grdnt) in damming events ovr E. U.S. Often slightly overforecasts strength of Arctic anticyclones Not enough cnvctn ovr plains (summ) Too wet in Florida
AVN Characteristics Cold bias (mainly E. U.S.) Genly 1st short range model to fcst cyclogenesis can be too slow deepening Best with filling cyclones Best psn fcst cyclones and anticy (days 2 & 3) too far N & W sfc cycl formg E of Rockies once upr trof…lee Rockies…OK
AVN Characteristics Often weakens Srn stream system or phases the 2 separate systems; Too slow…Arctic airmass in the plains Overdoes upslp pcpn Cntrl and Srn Rockies and strength of upslope flow Oct-April Avn QPF quite good competitive with Eta and btr than NGM
AVN Characteristics With strong wrapped up systems, forecasts hvy pcpn too far N & W Tracks tropical systems too far W Overdeepens weak tropical waves Overpredicts the # and strength of anticyclones ovr Grt Basin (cool ssn) Significantly underpredicts monsoonal precipitation
HPC QPF Summary Start with an accurate assessment of the atmosphere Pattern Recognition Know the model biases
Questions to ask when preparing Nowcasts and QPF“this involves” Satellite interpretations / signatures Satellite conceptual models satellite products
Global to Synoptic Scale Wetness of ground? Pattern recognition?
Soil (surface) Wetness Index (85 GHz - 19 GHz) (H) for January 1995
Soil (surface) Wetness Index (85 GHz - 19 GHz) (H) 5 day moving averages ending August 7, 1998
PATTERN RECOGNITION: 6.7 micron water vapor imagery for 11-26-97 0000 UTC; 300 mb winds (mps) are superimposed
PATTERN RECOGNITION: 6.7 micron water vapor imagery for 6-11-98 1200 UTC; 300 mb winds (mps) are superimposed
PATTERN RECOGNITION: 6.7 Micron for 2-3-98 1200 UTC; 300 mb winds (mps) are superimposed
Synoptic to Mesoscale Available moisture and stability? Presence of lifting or lid? presence of boundaries? (synoptic of mesoscale)
Use of Water Vapor(6.7 mm) Imagery middle - upper level flow fields and circulations lifting mechanisms - jet streaks - cyclonic circulations/lobes - trough axes - mid-level cold air advection excellent data for pattern recognition
6.7 mm Water Vapor Plumes Makes environment more efficient? Enhances precipitation through cloud seeding? associated with favorable synoptic patterns for low-level moisture and instability
WATER VAPOR PLUME: 6.7 micron water vapor imagery for 10-16-98 2345 UTC; 300 mb winds (mps) are superimposed
WATER VAPOR PLUME: 6.7 micron water vapor imagery for 10-17-98 1215 UTC
Precipitation Efficiency Factors Precipitable Water (PW) values ---- higher than 1.0 inch, enhances Precipitation Efficiency Mean environmental Relative Humidity (RH) ---- higher than 65 % results in less dry air entrainment into cloud masses
Precipitation Efficiency Factors • Depth of cloud with temperatures warmer than 0 degress C enhances the collision-coalescence process by increasing residence time of droplets in clouds --- this increases rainfall intensity and improves precipitation efficiency
Precipitation Efficiency Factors Vertical wind shear ---- produces entrainment and reduces Precipitation Efficiency, especially if environmental air is dry Cloud-scale vertical motion function of “CAPE” (Convective Available Potential Energy) related to condensate production and residence time of droplets
Additional Precipitation Efficiency Factors Storm-relative mean inflow and moisture transport into storm Duration of precipitation
Use of Precipitable Water (PW) and Relative Humidity (RH) Data magnitude transport (plumes) trends relation to equivalent potential temperature