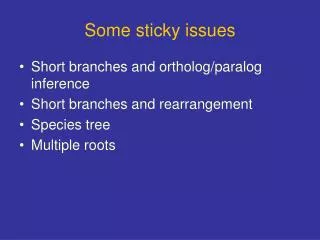
Some heavy precipitation issues
Some heavy precipitation issues. Heavy precipitation at a location = intensity x longevity. Common sources of heavy precipitation in U.S. Mesoscale convective systems and vortices Orographically induced, trapped or influenced storms Landfalling tropical cyclones.


Some heavy precipitation issues
E N D
Presentation Transcript
Common sources of heavy precipitation in U.S. • Mesoscale convective systems and vortices • Orographically induced, trapped or influenced storms • Landfalling tropical cyclones
MCSs & precipitation facts • Common types: squall-lines and supercells • Large % of warm season rainfall in U.S. and flash floods (Maddox et al. 1979; Doswell et al. 1996) • Initiation & motion often not well forecasted by operational models (Davis et al. 2003; Bukovsky et al. 2006) • Boundary layer, surface and convective schemes “Achilles’ heels” of regional-scale models • Improved convective parameterizations help simulating accurate propagation (Anderson et al. 2007; Bukovsky et al. 2006) • Supercells often produce intense but not heavy rainfall • Form in highly sheared environments • Tend to move quickly, not stay in one place
U.S. flash flood seasonality Contribution of warm season MCSs clearly seen Number of events Maddox et al. (1979)
Linear MCS archetypes(e.g., squall-lines) 58% 19% 19% Parker and Johnson (2000)
The multicell storm Four cells at a single time Or a single cell at four times: unsteady Browning et al. (1976)
The multicell storm Unsteadiness = episodic entrainment owing to local buoyancy-induced circulations. Browning et al. (1976) Fovell and Tan (1998)
Storm motion matters How a storm moves over a specific location determines rainfall received Doswell et al. (1996)
Storm motion matters Doswell et al. (1996)
Forecasting MCS motion (or lack of motion…)
19980714 - North Plains http://locust.mmm.ucar.edu/episodes
“Rules of thumb” “Why?” “Right for the right reason?”
Some common “rules of thumb” ingredients • CAPE (Convective Available Potential Energy) • CIN (Convective Inhibition) • Precipitable water • Vertical shear - magnitude and direction • Low-level jet • Midlevel cyclonic circulations
Some common “rules of thumb” • MCSs tend to propagate towards the most unstable air • 1000-500 mb layer mean RH ≥ 70% • MCSs tend to propagate parallel to 1000-500 mb thickness contours • MCSs favored where thickness contours diverge • MCSs “back-build” towards higher CIN • Development favored downshear of midlevel cyclonic circulations
70% layer RH 70% RH rule of thumb Implication: Relative humidity more skillful than absolute humidity RH > 70% # = precip. category Junker et al. (1999)
MCSs tend to follow thickness contours Implication: vertical shear determines MCS orientation and motion. Thickness divergence likely implies rising motion
Back-building towards higher CIN Lifting takes longer where there is more resistance
Corfidi vector method Cell motion vs. system motion
Corfidi vector method Propagation is vector difference P = S - C Therefore, S = C + P to propagate = to cause to continue, to pass through (space)
Schematic example A multicellular squall-line
Schematic example Cell motion as shown
Schematic example System motion as shown
Schematic example We wish to forecast system motion So we need to understand what controls cell motion and propagation
Individual cell motion • “Go with the flow” • Agrees with previous observations (e.g, Fankhauser 1964) and theory (classic studies of Kuo and Asai) Cells tend to move at 850-300 mb layer wind speed* *Layer wind weighted towards lower troposphere, using winds determined around MCS genesis. Later some slight deviation to the right often appears Corfidi et al. (1996)
Individual cell motion Cell direction comparable To 850-300 mb layer wind direction Cells tend to move at 850-300 mb layer wind speed Corfidi et al. (1996)
Composite severe MCS hodograph Selective composite already excludes non-severe, non-TS squalls Bluestein and Jain (1985)
Composite severe MCS hodograph Bluestein and Jain (1985)
Composite severe MCS hodograph Bluestein and Jain (1985)
Composite severe MCS hodograph Low-level jets (LLJs) are common Note P ~ -LLJ Bluestein and Jain (1985)
Propagation vector and LLJ • Many storm environments have a low-level jet (LLJ) or wind maximum • Propagation vector often anti-parallel to LLJ Propagation vector direction P ~ -LLJ Corfidi et al. (1996)
Forecasting system motionusing antecedent information Cell motion ~ 850-300 mb wind Propagation ~ equal/opposite to LLJ S = C - LLJ
Evaluation of Corfidi method Method skillful in predicting system speed and direction Corfidi et al. (1996)
Limitations to Corfidi method • Wind estimates need frequent updating • Influence of topography on storm initiation, motion ignored • Some storms deviate significantly from predicted direction (e.g., bow echoes) • P ~ -LLJ does not directly capture reason systems organize (shear) or move (coldpools) • Beware of boundaries! • Corfidi (2003) modified vector method
Composite severe MCS hodograph Low-level shear influences storm organization & motion Angle between lower & upper shear also important (Robe and Emanuel 2001) Bluestein and Jain (1985)
Low-level shear http://locust.mmm.ucar.edu/episodes
5 June 2004 X = Hays, Kansas, USA
5 June 2004 X = Hays, Kansas, USA
Potential vorticity Simplest form (see Holton. Ch. 4): absolute vorticity/depth is conserved for dry adiabatic processes. Equivalent to angular momentum conservation; stretching increases vorticity. This is a special case of Rossby-Ertel PV
Rossby-Ertel potential vorticity q incorporating: 3D vorticity vector, potential temperature gradient and Coriolis expressed as a vector (function of z only) In this formulation, mass x q is conserved between two isentropes even (especially!) if diabatic processes are changing the potential temperature Haynes and McIntyre (1987)
Rossby-Ertel potential vorticity q Here, we simplify a little bit and focus only on the vertical direction. The conserved quantity is mq. Holton’s version is derivable from Rossby-Ertel’s equation, where A is horizontal area. (Keep in mind ∆ is fixed between two isentropes.)
Rossby-Ertel PV For a dry adiabatic process, the mass between two isentropes cannot change. Thus, the only way to increase the cyclonic vorticity is to move the object equatorward (decreasing f) OR decrease its horizontal area A. Now, consider a more relevant example…
Start with a stably stratified environment, with no initial horizontal variation. Define two layers, bounded by these three isentropes. We are dealing with horizontal layers. Horizontal area A is not relevant.
m1 and m2 are the initial masses residing in these two layers. q1 and q2 are the initial PVs. mq can be transported horizontally but not vertically. So m1q1 and m2q2 will not change.
Introduce a diabatic heat source, representing convection. The potential temperature in the heated region increases. This effectively moves the isentrope 2 downward.