Download
1 / 48
590 likes | 1.22k Vues
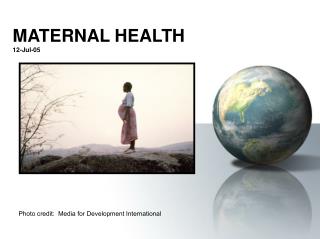
Monitoring and Evaluation: MATERNAL HEALTH PROGRAMS. Photo credit: Media for Development International. Learning Objectives. At the end of this session, participants will be able to: Describe a conceptual framework for maternal health

E N D
Monitoring and Evaluation: MATERNAL HEALTH PROGRAMS Photo credit: Media for Development International
Learning Objectives At the end of this session, participants will be able to: • Describe a conceptual framework for maternal health • Identify the main interventions/approaches to improve maternal health • Discuss core output and outcome indicators; recognize their strengths and limitations • Develop an M&E plan for a maternal health intervention
Maternal Health: Problem Annually, 585,000 women die of pregnancy related complications Every Minute... • 380 women become pregnant • 190 women face unplanned or unwanted pregnancy • 110 women experience a pregnancy-related complication • 40 women have an unsafe abortion • 1 woman dies from a pregnancy-relatedcomplication Source: JHPIEGO
WHY Do These Women Die? Three Delays Model • Delay in decision to seek care • Lack of understanding of complications • Acceptance of maternal death • Low status of women • Socio-cultural barriers to seeking care • Delay in reaching care • Mountains, islands, rivers — poor organization • Delay in receiving care • Supplies, personnel • Poorly trained personnel with punitive attitude • Finances
Global Targets Target 6 of the MDGs To reduce the maternal mortality ratio by three-quarters between 1990 and 2015.
Interventions to Reduce Maternal Mortality HISTORICAL REVIEW • Antenatal care • Traditional birth attendants • Risk screening CURRENT APPROACH • Skilled attendant at delivery
Preparing for Normal Birth Skilled attendant Place of delivery Finance Nutrition Essential items Readiness for Complications Early detection Designated decision maker(s) Emergency funds Communication Transport Blood donors RecommendedBirth Preparedness, Including Complication Readiness
ANC Recommendations (I) • Goal-directed visits by skilled provider • Four visits for normal pregnancy • Counseling • Nutrition, FP, danger signs, breastfeeding, HIV/STIs • Detection/management of existing diseases & conditions
ANC Recommendations (II) • Detection/management of complications • Prevention • All women: • Tetanus toxoid vaccination • Iron folate supplementation • Select populations: • Malaria intermittent preventive treatment • Routine hookworm treatment • Iodine supplementation • Vitamin A supplementation
Logical Framework Input Process Output Outcome Impact • I. Behavior Change • Birth Preparedness • Attendant at birth • Complication Readiness • Collaboration • Transport • Finances • Blood (walking donor) • Community availability of emergency transport • Trained providers in EmOC • Increased access to mat. health services • Increased competence of skilled birth attendants • Skilled attend-ance at birth • Increas-ed know-ledge of danger signs • Finance • Equipment • Supplies • Transport • Manpower Maternal and newborn Survival • II. Policy/Advocacy • Policy & environment for quality, access • III. Essential Ob. Care • In-service & pre-service training in EmOC
M&E Challenges (I) • Establishing causality • Maternal health is multifactorial • Improvements in overall health status are not necessarily followed by concomitant changes in mortality • Considerable time lag to measure mortality change
M&E Challenges (II) • Rarity of maternal deaths • Data collection costs • Confidence intervals • Identifying deaths related to early pregnancy and induced abortion • Establishing trends in maternal mortality • Reliable cause-of-death data are difficult to obtain
M&E Challenges (III) • Evaluation study design • Incomplete vital registration systems • Selectivity bias with health services data • Estimating denominators for facility-based maternal mortality rates • Rural-urban differences in maternal mortality may reflect differences in fertility patterns
Defining Maternal Death • According to the Tenth Revision of the ICD: • Maternal Death: • A maternal death is the death of a woman while pregnant or • within 42 days of termination of pregnancy, irrespective of the • duration and the site of the pregnancy, from any cause related • to or aggravated by the pregnancy or its management but not • from accidental causes (WHO 1993). • NOTE: 2 criteria • Temporal relationship to the pregnant state • Causal relationship to the pregnant state • Pregnancy-related death:“time of death” definition; • Irrespective of cause. • Late maternal death: The death of a woman from direct or indirect obstetric • causes more than 42days but less than one year after termination of pregnancy.
Maternal Mortality Indicators • Maternal mortality ratio • Maternal mortality rate • Life-time risk of maternal morality • Proportion maternal
Maternal Mortality Ratio MMRatio: N of maternal deaths in a specified period *100,000 N of live births in same period Interpretation: MMRatio = 50-250 per 100,000 live births Problems with quality of care MMRatio > 250 per 100,000 live births Problems with quality of care & access
Maternal Mortality Rate MMRate: N of maternal deaths in a specified period *1000 N of women of reproductive age • Relationship Between MMRate & MMRatio: • MM Rate = MM ratio * GFR • MM Ratio = MMRate / GFR • General fertility rate = (N of live births in a period) / (N of women of reproductive ages in a period) * 1,000
Relation Between Rate and Ratio • MM Rate = MM ratio * GFR • MM Ratio = MMRate / GFR • Example: the maternal mortality rate is 2 per 1,000 women 15-49 years and the general fertility rate is 200 per 1,000 women 15-49, what is the maternal mortality ratio? • Ratio = .002/.2 * 100,000 = 1,000 per 100,000 live births
Other Maternal Mortality Indicators • Life time risk of maternal mortality = (N of maternal deaths over the reproductive life span) / (women entering the reproductive period) • Proportion maternal = proportion of all female deaths due to maternal causes = (N of maternal deaths in a period/Number of all female deaths in same period) * 100
Where Do Maternal Mortality Data Come From? • Vital registration data - MM Rate and MM Ratio • Health service data – maternity registers - MM Ratio • Special studies • Hospital studies – tracing deaths, interviews • Research, longitudinal studies, verbal autopsy • Surveys & censuses • Direct estimation - Rate and Ratio • Sisterhood method (indirect) – Rate and Ratio
Sisterhood (Indirect) Method to Estimate Maternal Mortality • Questions are asked to female respondents 15-49 about the number of sisters and how many have died during pregnancy, childbirth and puerperium (no questions about age of sisters) • Gives life time risk and proportion of adult female deaths due to maternal causes • Gives deaths covering 40 year-period, centering on 12 years before the survey • What are the advantages of this method?
Direct Maternal Sibling Method to Estimate Maternal Mortality • Questions are asked to female (and male) respondents 15-49 about the sisters born to the same mother • age of surviving siblings • age at death of siblings who died • number of years ago the sibling died • whether the sister died during pregnancy, childbirth and puerperium (no questions about age of sisters) • Gives maternal mortality rate for 7-year period prior to the survey; gives age-specific mortality rates • Gives maternal mortality ratio, using the general fertility rate • What are the advantages of this method?
Maternal Mortality: Not Easy to Measure • Estimates not precise • Estimates refer to periods several years before survey • Surveys are expensive • Difficult to assess change due to wide confidence intervals on estimates • Maternal mortality should be measured once every 7-10 years
Measuring Maternal Morbidity • Misclassification of illness • Reliability • Small numbers
Measuring Quality of Maternity Care • No satisfactory standard tools for health facility comparisons • Finding adequate outcome indicators of quality • Case fatality rate? • Near-miss morbidity? • Output data more sensitive measures of quality than outcome data
Measuring Utilization of MH Services • Percent of births attended by skilled health personnel N of live births attended by skilled health personnel Total no. of live births • Percent of women 15-49 attended at least once during pregnancy by skilled health personnel
UNICEF, WHO, UNFPA “Process Indicators”: • Availability of Emergency Obstetric Care (EmOC) • Geographical distribution of EmOC facilities • % of births attended in an Emergency Obstetric Care facility • Cesarean section rates • Met Need for Obstetric Care • Case Fatality Rate (from hospitals) UNICEF, WHO, UNFPA, 1997
Indicators of Services Availability • Facilities • Basic Emergency Obstetric Care facilities per 500,000 population (4) • Comprehensive Emergency Obstetric Care facilities per 500,000 population (1) • Distributions • Geographic distribution UNICEF, WHO, UNFPA, 1997
Basic and Comprehensive EmOC Facilities BASIC EmOC Facilities Provide the first 6 Services • Antibiotics (intravenous or by injection) • Oxytocic Drugs (ditto) • Anticonvulsants (ditto) • Manual Removal of Placenta • Removal of Retained Products • Assisted Vaginal Delivery • Surgery (Cesarean Section) • Blood Transfusion
% of births attended in an Emergency Obstetric Care facility • (Number of live births attended in an EmOC facility)/(All live births*) (> 15%) * The numerator is the sum of births taking place in EmOC facilities. The denominator is restricted to live births simply due to the fact that data on pregnancies are not available (often estimated from census or other pop-based data).
Experience with % births in EmOC facilities • Requires collecting and summing information across facilities in a geographic area • Questions as to how important/feasible it is to ask health facility staff to adjust population totals • Requires knowledge as to the state of services being offered at multiple health facilities (ie, reaching criteria for Basic, Comprehensive obstetric care)
Population-based C-section Rates • (N of caesarian section operations in geographic area per time period)/(N of live births) (5-15%)* NOTE: must be interpreted entirely differently than hospital-based caesarian section rates. In Referral Hospitals, one may see C-Section Rates of 25-35% and that may be appropriate because of its referral status.
Case Fatality Rate • Percent of women with obstetric complications in a specific facility who die (1%) • Strengths & limitations • Definition of a “fatality” is straight forward • Easy to understand/interpret • Is best used in hospitals with a large volume of births/deaths • Follow up requires more in-depth investigation (maternal death audits or other qualitative methods)
Met Need for EmOC Percent of women with major obstetric complications who are treated (in a given geographic area and time period) (100%)* (N of women w/ ob.complications in facilities)/(15% of estimated live births in catchment area*)
Experience With “Met Need” • Assumes that the recorded complication was treated • Requires data on complications (RE: standardization of definitions, is it necessary?) • Will often require changing the delivery room register (adding a column) • Changing the register should be viewed as an intervention in and of itself • Whose responsibility is it to act on the results?
Utilization of “UN Process Indicators” • CALCULATING ALL 6 INDICATORS • Gives you an indication of where the problems lie and where action is needed. • Also, these indicators are sensitive to change: within months, you can know if your project is making a difference
Availability of EmOC • Problems: • Does Indicator # 1 show you need more EmOC facilities? • Does Indicator # 2 show you need better distributed EmOC facilities? • Action: • Most countries already have enough facilities; they may just need to upgrade services to ensure 1 Comprehensive and 4 Basic EmOC facilities per 500,000 population
Utilization of EmOC Problems • Does Indicator # 3 show that births in your EmOC facilities are fewer than 15% of all births in the population? • Does Indicator # 4 show that “Met Need” is less than 100%? (I.e. that not all women who experience obstetric complications are using EmOC facilities) • Does Indicator # 5 show that less than 5% of all births in the population are by Cesarean section?
Utilization of EmOC Action: Collect More Information First • Do you have enough qualified staff? • Do you need to train staff on management of emergency obstetric complications? • Does hospital management need improvement? • What’s the supply situation like? • What’s the equipment situation like? If all the above is in place, conduct focus groups in the community to find out why women are not coming for care
Quality of EmOC Action: Problem: • Does Indicator # 6 show that more than 1% of women treated for obstetric complications are dying at your EmOC facilities? • Find out if your EmOC facilities are really functioning • Check staff numbers, skills, management capacity, supplies and equipment • Lobby the health ministry for more support; get community to lobby with you
Summary on “Process Indicators” • UN process indicators only part of picture • Maternity record keeping important • Non-standard format • Incomplete, illegible, missing records • Non standard definitions of obstetric complications • Misclassification or non-recording of maternal death
Conclusions re Evaluation • In maternal health, no indicator of service provision or use is unequivocally linked to a reduction in maternal mortality • Maternal mortality unsuitable for documenting change at programme level • Attributing changes to the programme per se may be difficult, and providing ‘scientific’ proof of programme effectiveness may be not be achievable. Source: Ronsmans, 2001, HSOP #17, p 337 Continued
References • Campbell, O., Filippi, V., Koblinsky, M., Marshall, T., Mortimer, J., Pittrof, R., Ronsmans, C., and Williams, L. 1997. Lessons Learnt: A decade of measuring the impact of safe motherhood programmes. London: London School of Hygiene and Tropical Medicine. • Stanton, C., Abderrahim, N., and Hill, K. 2000. “An assessment of DHS maternal mortality indicators.” Studies in Family Planning 31(2): 111-123. • Thaddeus, S. and Maine, D. 1994. Too far to walk: maternal mortality in context. Social Science and Medicine 38(8): 1091-1110. • UNICEF, WHO, and UNFPA. 1997. Guidelines for Monitoring the Availability and Use of Obstetric Services. New York: UNICEF
Supplemental Slides I Measuring Service Utilization by Women With Complications • Count number of women with specific complications in the health facilities • Derive expected number of complications in a year • standard guesstimate: 15% of all deliveries have complications • estimate from self-reported data by women on the occurrence of complications in a survey (OVER METHOD) • Specific prevalence of complications based on literature
Supplemental Slides (II)OVER METHOD • Prevalence of specific complications, known from other studies (Pitroff, 1997): • breech at delivery: 31.7 per 1,000 deliveries • twin pregnancy: 28.4 per 1,000 deliveries • placental abruption:10 per 1,000 deliveries • placenta praevia: 3 per 1,000 deliveries • Example - In a district with an estimated 10,000 deliveries in a year, 40 breech deliveries were reported by the health facilities. What is the coverage of breech deliveries by health facilities?
Supplemental Slides (III)OVER METHOD Problem: • Example - In a district with an estimated 10,000 deliveries in a year, 40 breech deliveries were reported by the health facilities. What is the coverage of breech deliveries by health facilities? • Prevalence of breech at delivery: 31.7 per 1,000 deliveries (Pitroff, 1997) Answer: • 10,000 * 31.7/1000 = 317 breech deliveries are expected; coverage is 40/317 = 13%