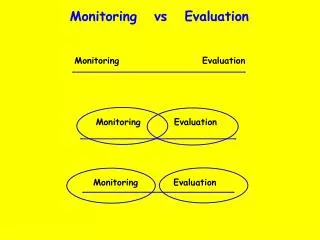
Monitoring vs Evaluation
Monitoring Evaluation. Monitoring Evaluation. Monitoring vs Evaluation. Monitoring Evaluation. WHEN Monitoring and Evaluation can Take Place Evaluation :. 2001: Start. Beginning. Formative. During. Summative. End. 2007: End. Monitoring:.

Monitoring vs Evaluation
E N D
Presentation Transcript
Monitoring Evaluation Monitoring Evaluation Monitoring vs Evaluation Monitoring Evaluation
WHEN Monitoring and Evaluation can Take Place Evaluation: 2001: Start Beginning Formative During Summative End 2007: End
Monitoring: • Monitoring only takes place “during”
End 1 Major 3 Minor Road 2 Road Level Crossing Town Major Start Road Motel
Monitoring (Car Journey): Keep Check on: • Fuel Gauge • Temperature Gauge • Engine Noise • Tyre Pressure • Speedometer • Clock
(possibleconfusionwith evaluation) Monitoring may involve some diagnosis and remedial action e.g.: • Luggage loose make secure • Fuel low fill up tank • Behind schedule increase speed
Monitoring is all about . . . KEEPING TO PLAN (It is not questioning the plan)
Evaluation: QUESTIONS THE PLAN (in some way)
For example: Is it the best way? Will it be achieved? What can we change to increase success? What have we learned? Is it worth doing?
Motel Stop Formative Evaluation Are we going to get there on time? Becomes Evaluation) Fuel leak: will it be disastrous? Traffic jam: should we abandon car and walk?
Other Evaluation questions: Is there a better way to do the journey (e.g. air/train)? How long will the car last? What maintenance will it require, etc., etc. Is the journey worth doing?
Good Bread ! ? Monitoring ?
MOST IMPORTANT Inputs: Process: Outputs: • Flour • Water • Yeast • Sugar • Salt • Oil • Time • Temperature • Size of Oven • Shape of Loaf • Position in Oven • Taste: • Delicious ! ? • Too sweet ! ? • Too salty ! ? • Nutritious ! ?
Good Schools Monitoring ?
Inputs: Process: Outputs: MOST IMPORTANT • Buildings • Equipment • Students • Teachers • Etc • Teaching Methods • Motivation of Students • No. of Teaching Hours • “Time on Task” • Etc • No. of “Graduates” • Exam Results • Jobs/Earnings • Etc
Means: End: Inputs Processes Outputs • Inputs and Process are only a means to an end • We should monitor inputs, processes and outputs • Outputs have greatest importance • Monitoring should also be used to help us understand: • relationships between inputs and outputs: e.g. • When an input changes, what effect does this have on outputs? • Which is the most important input? Etc.
MOST IMPORTANT Inputs: Process: Outputs: • Flour • Water • Yeast • Sugar • Salt • Oil • Flour • Time • Temperature • Size of Oven • Shape of Loaf • Position in Oven • Taste: • Delicious ! ? • Too sweet ! ? • Too salty ! ? • Nutritious ! ? • Taste:
Inputs: Process: Outputs: MOST IMPORTANT • Buildings • Equipment • Students • Teachers • Etc • Teaching Methods • Motivation of Students • No. of Teaching Hours • “Time on Task” • Etc • No. of “Graduates” • Exam Results • Jobs/Earnings • Etc • Exam Results • No. of Teaching Hours
There should be good reasons for collecting M&E data. • Known to all involved.
HOWDO WE INTERPRET DATA? • Have a reason for collecting data! • Know what we are looking for! • Form hypotheses/theories (Use the data to test them) • Look for patterns and trends:
DESIGNING MONITORING FORMS/QUESTIONNAIRES • Know the REASON for Every Question • What are we trying to find out? • Visualise a PICTURE of • possible response patterns • This Picture might help us to • REFORMULATE the question in a • better way
65% 60% 55% 50% 45% 40% 1950 1960 1970 1980 1990 2000 2010 2020 Boys as a Percentage of Enrolment Spotting TRENDS and Making PROJECTIONS is an important part of M&E! Girls as a Percentage of Enrolment
We then look for extreme variations: e.g “A” and “B” Why has “A” done so well? A Why has “B” done so badly? B Often, we identify the “Norm” or “Average” INTERPRETING DATA What can we learn? How can “A” help “B”?
Sometimes it might be desirable to move towards the “NORM” INTERPRETING DATA For Example: Class Size, or “Teacher/Pupil Ratio” BEFORE
Sometimes it might be desirable to move towards the “NORM” INTERPRETING DATA For Example: Class Size, or “Teacher/Pupil Ratio” AFTER
Sometimes it might be desirable to move towards the “Strongest Performers” INTERPRETING DATA For Example: Examination Results” BEFORE
Sometimes it might be desirable to move towards the “Strongest Performers” INTERPRETING DATA For Example: Examination Results” AFTER
Extra Monitoring/ Support Often, it is useful to sort data into Three Categories: 1 STRONG Why? 2 AVERAGE LESSONS! 3 WEAK Why?
METHODS OF COLLECTING DATA • Reports/Tables • Inspection/Field visits • Surveys/Questionnaires/Interviews • Participatory Meetings • Participatory Techniques (e.g SWOT Analysis, Matrix Ranking)
MODES: External Internal Formal Informal Announced Unannounced Written Oral Individuals Groups Participative Non-Participative During After
Method/ Source 1 +/- ? Method/ Source 2 TRIANGULATION OF DATA
INTERNAL OR EXTERNAL? Internal: • A better understanding • Vested interest in “positive reporting” Option ?: “Triangulate” using both!
The DOG (A)wags its TAIL (B) [“A”influences “B”] What is IMPORTANT (A) is MEASURED (B) [“A”influences “B”] But What if: The TAIL(B) wags the DOG (A) [“B” influences “A”] What is MEASURED (B) becomes IMPORTANT (A) [“B” influences “A”] GOOD! or BAD?
The TAIL(B) wagging the DOG (A) What is MEASURED (B) Becomes IMPORTANT (A) BAD? GOOD! Both Possible: Some People Argue: “Not everything that is important is measurable!” We can make things important (if we want!) by attaching importance to their measurement! A Useful Opportunity to bring aboutCHANGE!
M & E is a Four-Stage Process: 1 Gather Data 2 Process Data e.g. graphs/tables 3 Interpret Data e.g. trends/patterns 4 Use Findings e.g. to change practice, inform policy, etc Real M & E only occurs if: all four stages are carried through!
FOUR KEY QUESTIONS: • Where are we now? = Project Baseline Data • Where do we want to be? = Objectives • What do we have to do to get there? = Activities • How will we know when we have arrived? = Performance Indicators A B
2002 2003 2004 2005 Strong B A Project Baseline Weak
Strong Indicator: “Better Usage of Capacity” Minimum 85% Big Improvement! 65% A Baseline Weak 2003 2002 2008
2002 2003 2004 2005 Strong B Control Group A Project Baseline Weak
“ACCESS TO INFORMATION” • National Resource Database? • Website? • Who needs information? What information? • What is available now? What is not available?