Poverty Maps: Policy Applications
Poverty Maps: Policy Applications. Ken Simler Poverty Reduction and Economic Management (PREM) Poverty Reduction Group Poverty Analysis Workshop for Western Balkans Countries January 25, 2007. Poverty Maps: More than a pretty picture. Beyond the obvious targeting applications

Poverty Maps: Policy Applications
E N D
Presentation Transcript
Poverty Maps:Policy Applications Ken Simler Poverty Reduction and Economic Management (PREM) Poverty Reduction Group Poverty Analysis Workshop for Western Balkans Countries January 25, 2007
Poverty Maps: More than a pretty picture • Beyond the obvious targeting applications • not the targeting panacea initially hoped for • Building awareness, changing perceptions, opening poverty dialogue • Revisiting existing ideas and exploring new options (spatial correlates of poverty, coordination, etc) • Tailoring interventions to local needs (regional variations, location of intervention, funding formulas) • Strengthening accountability • Promoting evidence-based decision-making • Limitations
Increasing awareness about poverty • Raise the profile of poverty in public discourse • Morocco: Initiation of new National Human Development Initiative • Thailand: Maps revealed pockets of poverty • Contribute to debate on poverty definitions • Sri Lanka: Competing poverty lines had been in use; maps helped harmonize methodology. • Mexico: Numerous deprivation measures in use.
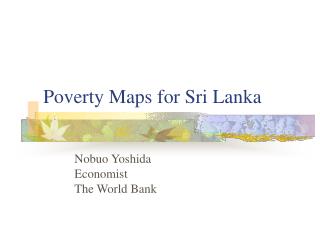
Correlating with other spatial data • Numerous overlays to examine the correlates of poverty and coordinate programs • Sri Lanka: Poverty and isolation/accessibility • South Africa: Containing a cholera epidemic • Tanzania: Changes in poverty and market access • Ecuador: Compare poverty maps at two points in time.
Each dot is randomly placed within a DS unit and represents 500 poor persons Sri Lanka overlays
Tailoring interventions to local needs • Cambodia: WFP combined with maps of nutrition, infrastructure, and vulnerability to flooding & drought to identify potential areas for WFP programs. • Morocco: Maps suggested different mechanism for urban vs. rural areas. • Vietnam: Validated targeting approach of Program 135.
Targeting interventions: Funding formula • Mexico: PROGRESA & Oportunidades • South Africa: Municipal grant amounts based on estimated number of poor • Kenya: Poverty incidence one of several criteria for Constituency Development Fund • Maps’ contribute to transparency and accountability • Limitations of geographic-based targeting
Promoting evidence-based decision making • Making fuller use of census data • Raising the profile of statistics in policy dialogue (government, donors, NGOs) • Strengthening statistical and analytical capacity
Limitations to remember • Poverty maps no better than the survey or census • Only as good as the analytical practices used • Maps capture one of many dimensions of poverty – a complementary source, not a replacement. • Map overlays show correlation – establishing causation requires deeper analysis. • Maps are static, and updating is infrequent. • Is geography the most relevant dimension?
Increasing the impact:10 Lessons about Process • Defining the scope of the effort • Define the objectives of the poverty map and how it fits into the larger organizational structure • Stakeholder analysis: identify potential and actual stakeholders and how they can be involved • Building political support • Identify champions to promote the poverty map. Should be (a) knowledgeable, (b) well-connected, and (c) senior. • Identify appropriate focal point for the poverty map process. • Engage early with key agencies and supporting counterparts. Strengthen support by broadening the audience at an early stage.
Increasing the impact:10 Lessons about Process • Create demand: build a network of users • Establish a users’ group early, drawing from different agencies. • Explain how the poverty map can be used • Keep users (including key policymakers) informed of progress and early findings • Remember the limitations of SAE poverty maps • Overcoming challenges, conflicts, tensions • Selecting an “official” poverty metric • Explain that different information sources are complementary • Role of poverty map as benchmark or validation • Recognize inertia and lack of incentives to change existing practices
Increasing the impact:10 Lessons about Process • Institutional arrangements for map production • Define work program • Identifying an institutional “home” • Benefits of multiple agency ownership • Creating institutional links with users • Embedding poverty map in broader poverty analysis and policymaking process • Integrating poverty map within the national monitoring system
Increasing the impact:10 Lessons about Process • Data issues • Securing access to census and survey data • Agreeing on access policy for poverty estimates and maps • Compatibility of data sources and platforms • Ensuring data quality for production • Matching census and survey data (esp. location identifiers) • Include experts on census and survey
Increasing the impact:10 Lessons about Process • Invest in long-term capacity to produce maps • Establish clear responsibilities & incentives • Identify capable people & transfer skills • Hardware & software needs • Dedicated human & financial resources • Disseminating poverty map products • Need dissemination plan (objectives, audience, formats, outlets, funding, etc.) • Different mediums and formats for different audiences • Identify appropriate events and venues • Remember the limitations
Increasing the impact:10 Lessons about Process • Supporting users (follow-up) • Building statistical literacy • Building capacity to analyze and use the data further • Showing applications • Role(s) of development partners • Various: Technical support, funding, dissemination
More Information • More Than a Pretty Picture: Using Poverty Maps to Design Better Policies and Interventions (June 2007) • http://www.worldbank.org/povertymap/ • http://www.ciesin.org/povmap/