Severe convective storm modeling
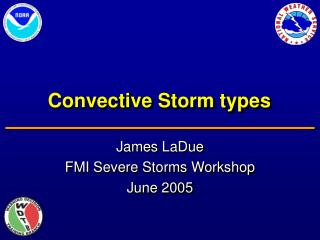
Severe convective storm modeling. Kay Cleary. Meghan Purdy. Director, Regulatory Practice. Associate Manager, Model Solutions. What peril concerns you on a day-to-day basis?. A recent survey. In your opinion, what is the biggest threat regarding climate change?.

Severe convective storm modeling
E N D
Presentation Transcript
Severe convective storm modeling Kay Cleary Meghan Purdy Director, Regulatory Practice Associate Manager, Model Solutions
What peril concerns you on a day-to-day basis? • A recent survey In your opinion, what is the biggest threat regarding climate change? Has your company made changes to your severe weather ratemaking methodology in the last 3 years?
#1: SCS #2: Flood #3: Hurricane • A recent survey SCS, Flood, and Storm Surge/ Hurricane ~80% yes!
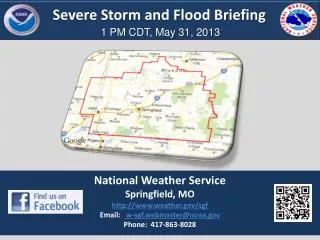
Loss Accounts for 1/3 of all US peril AAL (~11 billion USD) Risk Overview Historical Losses Several events in last 15 years exceed $2 billion in loss 3 events in 2011 1 so far in 2013 Risk High risk to aggregate covers, auto lines, and large single location risks Eats at profit, as most risk is retained Challenges Event frequency not well captured in statistical data SCS annual losses can be volatile/non-stable
Intro to the RMS Severe Convective Storm model • Applications and considerations • Resilient risk management • outline
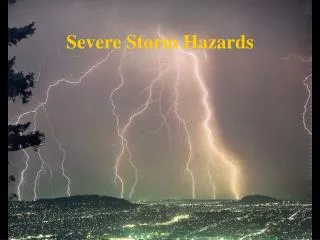
Hail • Most frequent of SCS perils • Auto and Residential lines most at risk • Smaller damage ratios, over large areas • Tornadoes • Rarest of the SCS perils • Highest damage ratios • Straight-line winds • Largest footprints of SCS perils • Treefall an issue for residential and auto • Lightning • Frequent, but least damaging • Losses to electrical equipment (power surge) • Four Perils of Severe Convective Storms
Framework for SCS Modeling Generate Events Assess Hazard Quantify Financial Loss Calculate Damage
Challenge: define the peril Image via foldedstory.com
Tornadoes are #1 driver for loss of life • 324 deaths in April 2011 outbreak • Last death due to hail in US was 12 years ago; ~1,000 deaths due to tornadoes in same period • Hail storms are #1 driver for insurance loss • Aggregate loss: hail is dominant, 60% of all claims • Tail loss: hail & tornado are ≈ 40% • Challenge: define the peril Annual Losses Large Event Losses Tornado Straight-line Wind Straight-line Wind Tornado Hail Hail Based on Claims Data
Low High Challenge: biased historical records Hazard
Step 1 Step 2 Step 3 Step 4 SCS event generation • Resample events from the North American Regional Reanalysis (NARR) • Reanalysis data from 1979-2005 • Create “stochastic” years • 3-day blocks within 3 month periods • Over 27 years of data • Preserve seasonality • Preserve temporal and spatial correlations Simulate stochastic years of atmospheric conditions Stochastic Year 1 Stochastic Year 2 NARR Day Stochastic Day NARR Day Stochastic Day Year 12, Day 12 Day 1 Year 22, Day 12 Day 1 Year 12, Day 13 Day 2 Year 22, Day 13 Day 2 Year 12, Day 14 Day 3 Year 22, Day 34 Day 3 Year 03, Day 20 Day 4 Year 05, Day 20 Day 4 Year 03, Day 21 Day 5 Year 05, Day 21 Day 5 Year 03, Day 22 Day 6 Year 05, Day 22 Day 6 Year 26, Day 33 Day 7 Year 27, Day 33 Day 7 Year 26, Day 34 Day 8 Year 27, Day 34 Day 8 Year 26, Day 35 Day 9 Year 27, Day 35 Day 9 Day 365 Year 14, Day 323 Day 365 Year 16, Day 311
Step 1 Step 2 Step 3 Step 4 SCS event generation • Combine NARR atmospheric conditions and historical observations • Create probability of specific perils occurring at a location • Climatology of risk • Surface shear/CAPE triggers event initial location • CAPE (Convective Available Potential Energy, a measure of energy to feed storm development) • Wind Shear (to provide rotation for updrafts and tornadogenesis) • Size/intensity event as function shear/CAPE Create probability surface based on atmospheric conditions for an event CAPE or shear atmospheric conditions # Historical Occurrences CAPE or Shear 14
Step 1 Step 2 Step 3 Step 4 SCS event generation • Contents of event modeled as function shear/CAPE independently • Individual peril intensity relationships • Derived from observations • Wind: anemometer network • Tornado: F-Scale • Hail: radar Perils & intensity based on probability surface and CAPE/Shear values Hail Swath and Intensity Straight Line Wind Intensity correlated Tornado Frequency & Intensity Lightning Footprint 15
Step 1 Step 2 Step 3 Step 4 SCS event generation • Some events will contain single, multiple, or all perils Hail Intensity1/ Intensity 2 Lightning Tornado Path Apply peril footprints for event given probability and intensity information 16
SCS event generation: Putting it All Together A hybrid model that unites statistics with numerical modeling Numerical modeling provides thousands of years of large-scale, 3D meteorological “ingredients” for storms Statistics are used to place tornado, hail, and straight-line winds in each cell using probability distributions and historical data Result is verified and calibrated against historical observations and damage surveys where appropriate Shear CAPE
High-frequency events can contribute over 50% of the annual AAL in some regions, particularly in the West • Impractical to model as individual events • SCS model’s solution: • Determine percentage of claims from high-frequency events, verify with CAPE as proxy for thunderstorms • 1 pseudo-event per state • Model as an annual occurrence (frequency = 1) for the aggregate contribution of high-frequency events to the location AAL • Challenge: high-frequency events 2011 IED, All Lines, All Subperils
Challenge: high-frequency events High-frequency event: Isolated t-storms/wind Low-frequency event: Major severe weather outbreak
Hailstorms • Many hail swaths per day possible • Calibrated with 50 years of observations • Hail swaths often occur in clusters • Modeled at two intensity levels • Intensity related to hail stone size and density • Intensity distribution varies geographically • Number of hail swaths, size, and intensity distribution dependent on storm size • Footprint morphology calibrated on historical and radar data Intensity 2 Hail Pad • Hail Intensity 1 Hail Pad Stochastic Hail Swath Ellipses fitted to the SPC points for the event of 3 May 1999, along with the WDT polygons from radar.
Ranging from microburst to derecho (1 mn/yr vs. 25 year) • Derecho – widespread, long-lived convective windstorm • Size: 3 miles to 100+ miles wide • Duration: minutes to 24 hr • Wind speeds: up to 100 mph gust • Methods of reconstructing straight-line winds • Storm Prediction Center historical reports • Airport locations, mesonet stations, Global Summary of the Day • Examine roughness • Straight-Line Winds Wind Surface Grid MPH
Outbreak modeled by maximum F-intensity tornado • Historical tornado reports are clustered into larger outbreaks (similar to hail) • Intensity size distributions based on Rankine vortex model • Adjusted with high-resolution damage surveys (from scientific literature, consultants) • Tornado Tornado intensity based on Rankine vortex model. Goshen County WY: June 5th, 2009 Vmax
Losses from lightning strikes(non-fire) • Two main damage modes: • Damage at point of entry (singe or burn marks) • Electrical system (electronics that are plugged in) • Typically low damage ratios • Highly correlated with hail hazard so modeled on top • Lightning
Distinct functions for Hail, Tornado, and Wind • Hail kinetic energy • Key vulnerability components: • General roof shape (e.g. steep, low slope) • Roof cover (e.g. asphalt, shake, tile, built-up, single-ply) • Roof age (critical age ~10-15 years for most types) • Tornado F-rating • Relates damage to approximate wind speed range • Straight-line winds peak gust • Dominant range of wind speeds < 80 mph • Tree damage • Use of claims data and consultants for calibration/validation • Peril-Specific Vulnerability Functions Photos from RMS (Matthew Nielsen)
Interim update of SCS model in January 2014 • Fundamentals of event generation module still strong • 2008-2012 taught us new lessons that we wish to integrate • Add information on tail events and EPs from 2008-2012 SCS seasons • Integrate new client data to further refine hazard and vulnerability • Future model updates: risklink
exposure • Future model updates: Rms(one) vulnerability Event rates • Spring 2014: SCS translated for use on RMS(one) • More powerful platform to make the model work for you: • Conduct sensitivity tests • Leverage your own claims data and research • Gain competitive advantage HAZARD pla loss
Implications and applications • Ratemaking (primary companies) • Statewide level • Territorial • Class Plans • Policy Terms • Transfer of Risk (e.g., reinsurance) • Concentration of Risk
Any vertically developed thunderstorm that produces damage due to hail, tornado, and/or a straight-line wind • Can occur in all states and provinces in the U.S. and Canada any time during the year • Peril model and catastrophe model • Event can be • Synoptic* system • Used in RiskLink to capture high-frequency losses • how events are defined SPC Risk Map *synoptic = large scale atmospheric phenomenon
Experience data • Low frequency • PCS definition • >=$25M industrywide, and • >=$5M for any state • Gross loss • Lifetime of synoptic system • Company ID • ~$Ms • High frequency • Remainder – “follows” low freq • One “event” per year for each state • $10,000s to $100,000s
Rates within a state or region • Does geographic location within a state matter for SCS? Do you need to have territorial differentials? • What about other characteristics?
AAL by Primary Characteristics • Reference Structure: 200k structure, 150k contents, 40k ALE ($250 deductible) • Selected location in Midwest
Primary Characteristics: number of stories Risk is primarily determined by the roof system covering and its value relative to the remainder of the structure • Brick veneer structure example • $100,000 per story replacement cost • $15,000 for roof 7% Damage Ratio 5% Damage Ratio 13% Damage Ratio
Secondary modifiers Secondary modifiers are invoked only when sufficient primary characteristics are known: occupancy, construction class, year of construction, and building height
Return period of an F2 or greater tornado at a point in 1,000’s of years 100,000 50,000 20,000 10,000 5,000 2,000 • Location-level risk is fundamentally different for SCS than for other perils like hurricane • The RP of hurricane winds at a location is generally less than 100 years in high risk areas • The RP of an F2 at a location is measured in the THOUSANDS of years in high risk areas • How do you think about risk at a location basis? Source: Meyer et al. 2002
Real-world case study: • Take a book of business for a particular state, and change the deductible from $250 to 1% of the limit • Determine the change to AAL and RP losses as a result • deductibles • Given that AAL is driven in large part by hail, damage ratios for SCS tend to be on the smaller side (5-10%) • These types of loss ratios can be very sensitive to the deductible chosen when modeling SCS
Hurricane Exceedance Probability Gross Loss • Risk transfer considerations • Tail of distribution • Aggregate EP • ~80% less than 72 hour duration US HU AEP US HUOEP Severe Convective Storm US SCS AEP US SCS OEP Exceedance Probability Gross Loss
Looking at accumulation using a sample tornado footprint may be more helpful for understanding the amount of exposure at risk for ‘the big one’ Exposure accumulation for tornadoes Given the small footprint size for tornadoes, what are some ways to examine the worst-case scenarios? Develop a sample tornado ellipse using size parameters for long-lived/large tornadoes Place over hotspots of exposure and use simple damage ratios to calculate sample loss
May need additional expected $$ • Included • Tree fall • Debris removal • Power outage if there is direct damage to the location • Nonmodeled losses • Flood • Fire following • Power outage off premises unless there is direct damage to the location • Can model auto
More information • RMS document in response to ASOP #38: Using Models Outside the Actuary’s Area of Expertise (Property and Casualty) • Provides basic understanding of the model • Non-proprietary – just ask
Models aren’t perfect Resiliency in principal Resiliency in practice • Resilient risk management