Download
1 / 32
330 likes | 519 Vues
A study of the Molecular-FIR-Radio correlation at small scales in the Galaxy. Mónica Ivette Rodríguez Dr. Laurent Loinard (UNAM - México) Dr. Tommy Wiklind (STScI - USA) Dr. Ron Allen (STScI - USA). Outline. Introduction Previous work (cold molecular gas)

E N D
A study of the Molecular-FIR-Radio correlation at small scales in the Galaxy Mónica Ivette Rodríguez Dr. Laurent Loinard (UNAM - México) Dr. Tommy Wiklind (STScI - USA) Dr. Ron Allen (STScI - USA)
Outline • Introduction • Previous work (cold molecular gas) • Current studies on the RC-FIR correlation • Future analysis
Introduction The main goal of studying spiral galaxies is to understand how stars form and how the star formation is related to dynamical and physical conditions in the interstellar medium through several different diagnostics. Examples : Ionizing continuum radiation (UV) Balmer lines near-infrared, mid-infrared Dust emission (far-infrared) Molecular emission (CO) Radio continuum
FIR-CO correlation FIR-RC correlation Log LFIR(L) Log [h21.49 GHz (WHz-1)] RC-CO correlation Log LCO(K km/s pc2) Log (h2LFIR/L) Tutui et al. (2002) Condon1992 L1.4cos(i) (mJy/sterad) Paladino et al. (2006) LCOcos(i) (Jy/steradkm/s)
Introduction These correlations hold when viewing galaxies on global scales; however, the emission mechanisms and the processes driving the emission are different. The physical bases for understanding the molecular-FIR-RC correlation are not well understood, and several effects can modify the basic correlation such as density waves, etc. In my PhD. Project I will study these correlations, most notably, the far-infrared and radio continuum correlation on scales corresponding to the size of small molecular clouds.
Our previous work We carried out a search of cold molecular gas in the Galaxy : H2 is not observable at radio wavelengths 12CO has been the most popular tracer * Optically thick line H2CO is an absorption line against CMB We chose two regions to observe H2CO in our Galaxy : * The Galactic Anticenter * L1204/S140 region
Our previous work Results : We found a good general correlation between 12CO and H2CO * Both line are spatially co-exiting There are, however, small differences in the correlation that can be due to: * 12CO is a optically thick line * Photodissociation affects the H2CO abundance Main conclusion : Both lines generally traces warm and dense gas in the ISM
RC-FIR Correlation The correlation between the RC and FIR emissions of the galaxies, was hinted ~ 30 years ago (van der Kruit, 1971) Thanks to IRAS all-sky survey (particularly at 60 µm and 100 µm bands) was demonstrated how tight and universal that correlation is : It applies to galaxies of many different Hubble types, from faint dust-rich dwarf to ultra luminous infrared galaxies (de Jong et al. 1985, Helou, et al 1985) More recently the same RC-FIR correlation still holds for galaxies at significant cosmological distances (Appleton et al. 2005)
RC-FIR Correlation Massive OB stars When the star dies.. Thermal Radio emission (free - free) HII Regions Non-Thermal Radio emission (synchrotron) SNR Far IR Emission dust heated Radio Emission RC-FIR correlation
RC-FIR correlation “Global” The relation between the infrared and the non-thermal radio emission is expected to be only global. It breaks down at scales below about 1kpc Massive OB stars When the star dies … FIR emission dust heated Non-Thermal Radio Emission (Synchrotron) SNR non-thermal RC-FIR global
RC-FIR correlation “Local” The dust has 2 components : Warm : T ~ 45 K (dust heated by nearby stars) Cold : T ~ 20 K (dust in the diffuse general interstellar medium) Then correlation between the warm dust component and the thermal radio emission is clearly expected local, since both are directly related to massive star-formation Massive OB stars Thermal Radio Emission (free-free) HII Regions Warm FIR emission thermal RC-FIR local
Motivation Such correlation is indeed needed to explain the overall radio-infrared correspondence Hoernes, Berhuijsen & Xu (1998) showed that it still holds at scales of about 1 kpc in M31 Murphy et al. 2005 combined new Spitzer data with archival radio observations of M51 conclude that this correlation still holds at 750 pc Studies on the LMC show that the RC-FIR correlation still holds on scales between 0.05 and 1 kpc (Hughes et al. 2006) * Why should there be a good global correlation between the FIR and the non-thermal RC but not at all expected in the local interstellar medium? * What could be the linear size scale at which the RC-FIR correlation breaks down? We proposed to study it at much smaller scales … Milky Way
RC-FIR correlation in our Galaxy Boulanger and Perault (1988) consider the case of the Solar neighborhood and the Orion complex They found different average values for the radio-to-infrared in these two regions Given the wealth of observations available for the Milky Way, we can expand significantly that work
RC-FIR correlation in our Galaxy Method : Get a sample of regions of our Galaxy (blind search) Compare the RC emission with the FIR emission for each region Check the nature of the RC emission (thermal or non-thermal) Search for possible associated sources
Sample of regions We have downloaded all mosaic images at 408 MHz, 1420 MHz, 60 µm and 100 µm from the Canadian Galactic Plane Survey (CGPS) database at Dominion Radio Astrophysical Observatory (DRAO) http://www.ras.ucalgary.ca/CGPS/ Catalog features: - 68 mosaic images available (5o 5o) - Range : 62o.2 < l < 175o.3 -3o.5 < b < +5o.5 99o.8 < l < 113o.0 +4o.5 < b < +17o.5 117o.0 < l < 118o.0 +4o.5 < b < +17o.5 Resolution : 49” 49” cosec at 1420 MHz 2’.8 2’.8 cosec at 408 MHz - Taylor et al. 2003
Selection criteria of the regions: • * Well defined and extended sources (not filamentary structures) • * Longer that 25’ 25’ • * Tb > 4 • * Far from the galactic plane (isolated) Results : 29 Galactic Regions from the radio continuum images, calculate its sizes, equatorial coordinates, and the resolution at 408 MHz and 1420 MHz
Image reconstruction Clean point sources, smooth, remove background
Additionaly … * Search possible associated sources using the SIMBAD Astronomical Database This was done just selecting the sources that fall in the same coordinate field for each region. We used the Sharpless HII regions, Lynds dust nebula and Green SNR catalogs for this search. * Background spectral index map
Spectral Index Calculation The temperature spectral index is defined as : Rayleigh-Jeans Approximation :
s: synchrotron ~ 0.7 f: free-free : optically thin ~ 0.1 optically thick ~ -2.0 d: dust ~ 1.5 Spectral Energy Distribution d s sum f
Spectral Index Error Calculation Uncertainty of the spectral index :
Results Spectral index distribution map Error map
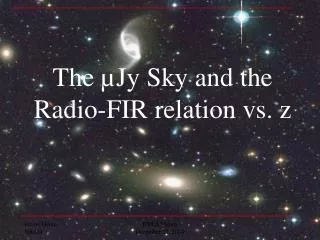
408 MHz 1420 MHz Region Spectral index map Error map FIR emission Background Spectral index map
1420 MHz 408 MHz Error map Region Spectral index map FIR emission Background Spectral index map
We also have set the regions in different classes as follows : Class 2.- a) small clumps (< 30’) b) big clumps (> 30’) Class 1.- SNR shape Class 3.- bright head clump with a tail Class 4.- big regions with internal structure
Preliminary Conclusions From the results, our main conclusion is that the RC-FIR correlation still hold to small scales since most of the objects in our sample has a FIR counterpart However, the Radio Continuum emission results to be for the most part thermal for regions that have FIR counterpart. This suggests that such objects do not contribute at all to the non-thermal RC-FIR correlation It seems that the non-thermal Galactic background radio continuum emission is the main component contributing to the correlation
Publications “Anomalous H2CO Absorption toward the Galactic anticenter : A blind search for dense molecular clouds” (Rodríguez el al., 2006, ApJ, 652, 1320) ---------------------------------------------------------------------------------------------------- “Anomalous H2CO Absorption in the L1204/S140 Region and a Comparison with CO(1-0) emission” (Rodríguez el al., 2007, ApJ, 663, 824) “The RC-FIR correlation at small scales in the Galaxy” (Rodríguez el al. in prep.)
Future Work • Conclude a paper with the result already present in this report. Make a detailed analysis of the results in order to have more hints to explain the behavior of the RC-FIR correlation. • In order to get additional information about our sample of regions we will check if the regions/objects we had chosen have been studied or referenced before. • The linearity of the RC-FIR correlation have been previously studied on galaxies (Yun et al. 2001). In order to determinate the linearity of the RC-FIR correlation in our Galaxy, we will construct a logarithmic FIR/radio maps from the IRAS and Radio continuum maps using the next equation to all the regions of our samples. This also will allows us to confine the size scale at which the correlation breaks down.
Future Work • Return to my home institution in México and prepare an additional paper including the results about the analysis describe before. • Write the PhD thesis and present my the dissertation.