Download

1 / 73
730 likes | 942 Vues
Small Galaxy Groups Clustering and the Evolution of Galaxy Clustering. Leopoldo Infante Pontificia Universidad Católica de Chile. Bonn, June 2005. Talk Outline. Introduction The Two-point Correlation Function Clustering of Small Groups of Galaxies – SDSS results

E N D
Small Galaxy Groups Clusteringand the Evolution of Galaxy Clustering Leopoldo Infante Pontificia Universidad Católica de Chile Bonn, June 2005
Talk Outline Introduction The Two-point Correlation Function Clustering of Small Groups of Galaxies – SDSS results Evolution of Clustering – MUSYC results Conclusions
Rich Clusters Bias Groups Bias Galaxies Bias
How do we characterizeclustering? Correlation Functions and/or Power Spectrum
Random Distribution 1-Point 2-Point N-Point dV1 Clustered Distribution r 2-Point dV2
Continuous Distribution Fourier Transform Since P depends only on k
In Practice 2-Dimensions - Angles Estimators B A
r0 vs dc On the one hand, The Two point Correlation Function is an statistical tool that tells us how strongly clustered structures are. • Amplitud (A), or • Correlation length (r0) On the other, we need to characterize the structure in a statistical way • Number density (nc) • Inter-system distance (dc)
Assumed Power Law 3-D Correlation Function Proper Correlation distance Clustering evolution index Proper Correlation length Assumed Power Law Angular Correlation Function
To go from r • Must do a 2D 3D de-projection • Limber in 1953 developed the inversion tool • Two pieces of information are required: • A Cosmological Model • The Redshift Distribution of the Sample
With z information • Redshift space correlation functions • Given sky position (x,y) and redshift z, one measures s • Sky projection, p, and line of sight, , correlation functions • Given an angle, , and a redshift, z, one measures rp, Problem; choose upper integration limit
Proper Volume Space density of galaxy systems Mean separation of objects As richer systems are rarer, dc scales with richness or mass of the system
CLUSTERINGMeasurements from Galaxy CatalogsandPredictions from Simulations
Galaxy Clustering: Two examples APM angular clustering SDSS spatial clustering
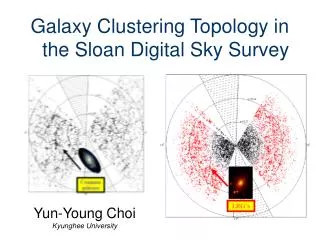
Sloan Digital Sky Survey • 2.5m Telescope • Two Surveys • Photometric • Spectroscopic • Expect • 1 million galaxies withspectra • 108 galaxies with 5 colors • Current results • DR2 • 2500 deg.2 • 200,000 galaxies, r<17.7 • Median z 0.1
Clustering of Galaxy Clusters Richer clusters are more strongly clustered. Bahcall & Cen, 92, Bahcall & West, 92 However this has been disputed: • Incompleteness in cluster samples (Abell, etc.) • APM cluster sample show weaker trend
Galaxy Groups Clustering Simulations 2dFGG clustering LCDCS clustering SDSS DR2 clustering
N body simulations • Bahcall & Cen, ‘92, ro dc • Croft & Efstathiou, ‘94, ro dc but weaker • Colberg et al., ‘00, (The Virgo Consortium) • 109 particles • Cubes of 3h-1Gpc (CDM) CDM =0.3 =0.7 h=0.5 =0.17 8=0.9
CDM dc = 40, 70, 100, 130 h-1Mpc Dark matter
2dF data, 2PIGG galaxy groups sample Ecke et al., 2004 19,000 galaxies 28,877 groups of at least 2 members <z> = 0.11
Padilla et al., 2004 Groups 2PIGG Galaxies 2dFGRS
Las Campanas Distant Cluster Survey Gonzalez, Zaritsky & Wechler, 2002 • Drift scan with 1m LCO. • 1073 clusters @ z>0.3 • 69 deg.2 • 78o x 1.6o strip of the southern sky (860 x 24:5 h-1 Mpc at z0.5 for m=0.3 CDM). • Estimated redshifts based upon BCG magnitud redshift relation, with a 15% uncertainty @ z=0.5.
Clustering of Small Groups of Galaxies from SDSS
Objective: Understand formation and evolution of structures in the universe, from individual galaxies, to galaxies in groups to clusters of galaxies. • Main data: SDSS DR1 • Secondary data: Spectroscopy to get redshifts. • Expected results: dN/dz as a function of z, occupation numbers (HOD) and mass. • Derive ro and d=n-1/3 Clustering Properties
Bias • The galaxy distribution is a bias tracer of the matter distribution. • Galaxy formation only in the highest peaks of density fluctuations. • However, matter clusters continuously. • In order to test structure formation models we must understand this bias.
Halo Occupation Distribution, HOD Bias, the relation between matter and galaxy distribution, for a specific type of galaxy, is defined by: • The probability, P(N/M), that a halo of virial mass M contains N galaxies. • The relation between the halo and galaxy spatial distribution. • The relation between the dark matter and galaxy velocity distribution. This provides a knowledge of the relation between galaxies and the overall distribution of matter, the Halo Occupation Distribution.
In practice, how do we measure HOD? • Detect pairs, triplets, quadruplets etc. n2 in SDSS catalog. • Measure redshifts of a selected sample. • With z and N we obtain dN/dz • Develop mock catalogues to understand the relation bewteen the HOD and Halo mass
OUR PROJECT: We are carrying out a project to find galaxies in small groups using SDSS data. Collaborators: M. Straus N. Padilla G. Galaz N. Bahcall & Sloan consortium
The Data • Seeing 1.2” to 2” • Area = 1969 deg2 • Mags. 18 < r < 20
Selection of Galaxy Systems • Find all galaxies within angular separation between2”<<15” (~37h-1kpc) and 18 < r < 20 • Merge all groups which have members in common. • Define a radius group: RG • Define distance from the group o the next galaxy; RN • Isolation criterion: RG/RN 3 Sample 3980 groups with 3 members pairs68,129 Mean redshift = 0.22 0.1
Galaxy pairs, examples Image inspection shows that less than 3% are spurious detections
Results arcsec arcsec A = 13.54 0.07 = 1.76 A = 4.94 0.02 = 1.77
Results pairs triplets galaxies • Triplets are more clustered than pairs • Hint of an excess at small angular scales
Space Clustering Properties-Limber’s Inversion- Calculate correlation amplitudes from () Measure redshift distributions, dN/dz De-project () to obtain ro, correlation lengths Compare ro systems with different HODs
The ro - d relation Amplitude of the correlation function Correlation scale Mean separation As richer systems are rarer, d scales with richness or mass of the system
Rich Abell Clusters: • Bahcall & Soneira 1983 • Peacock & West 1992 • Postman et al. 1992 • Lee &Park 2000 • APM Clusters: • Croft et al. 1997 • Lee & Park 2000 Galaxy Triplets EDCC Clusters: Nichol et al. 1992 • X-ray Clusters: • Bohringer et al. 2001 • Abadi et al. 1998 • Lee & Park 2000 LCDM (m=0.3, L=0.7, h=0.7) SCDM (m = 1, L=0, h=0.5) Governato et al. 2000 Colberg et al. 2000 Bahcall et al. 2001 • Groups of Galaxies: • Merchan et al. 2000 • Girardi et al. 2000