
Chapter 1
Chapter 1. Properties of the Atmosphere. How is the atmosphere characterized?. Preliminaries. 90% of the atmosphere’s mass is between mean sea level (MSL) and 12 km (7.5 mi) above MSL Atmospheric compostion: N 2 , 78%; O 2 , 21%; water vapor is variable but very important;

Chapter 1
E N D
Presentation Transcript
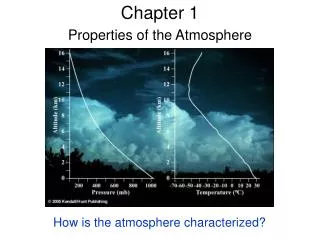
Chapter 1 Properties of the Atmosphere How is the atmosphere characterized?
Preliminaries • 90% of the atmosphere’s mass is between mean sea level (MSL) and 12 km (7.5 mi) above MSL • Atmospheric compostion: • N2, 78%; • O2, 21%; • water vapor is variable but very important; • aerosols, clouds, precipitation • Forms of water in the atmosphere • Vapor (gas) • Liquid (cloud droplets and rain drops) • Solid (ice crystals and ice precipitation)
Temperature • Defined as a measure of the average speed (energy of motion) of molecules in a substance. • Well, what about liquids and solids? • Molecules in solids experience vibrations • Molecules in a liquid have limited path lengths over which no collisions take place
Metric system • Length: meters (m) or kilometers (km) • Time: seconds (s) • Speed: m s-1; acceleration: m s-2 • Mass: kilogram (kg) • Density: kg m-3 • Force: Newton (N, kg m s-2) • Pressure: Pascal (Pa, N m-2 = kg m-1 s-2) • Energy: Joule (J, N m = kg m2 s-2)
Distribution of surface (2 m AGL) temperature in January and July T = temperature What causes temperature changes? - Daily variation? - Annual variation?
Pressure • Force per unit area (Pa = N m-2) • Weight of a column of air above a unit area • All molecules are summed in that column
Moisture • Water vapor • Clouds • Precipitation • Water vapor’s benefit • Measurements of water vapor
Measures of water vapor • Vapor pressure • Partial pressure (e) due to water vapor • A direct measure of the total number of H2O molecules • Dew point temperature • Temperature at which saturation is attained • Saturation 100% relative humidity (e = es) • RH = e/es (see p. 11) • Commonly plotted on surface weather maps • Depends on (a) amount of water vapor in the air, and (b) the amount of water vapor that the air can “hold” at a given temperature
Average vapor pressure (e) and dew point temperature (D) in Jan. & July lowest highest lowest highest Note the relationship between e and D
Saturation vapor pressure and T RH = Relative humidity RH = (vapor pressure / saturation vapor pressure) x 100% or RH = e/es The curve is exponential, meaning that the rate of increase in es with increasing temperature increases as T increases. es = Ae-B/T
Daily variation of T and RH What is the relation between T and RH? If the absolute amount of water vapor does not change, then at low T, RH is high, and at high T, RH is low. Look at the behavior of RH and T today here in Huntsville.
Extra!! Integrated water vapor TOA • Precipitable water (PW) • The depth of liquid water that would result if all of the water vapor in the column between the surface and the “top of the atmosphere” were condensed. • Refer to NSSTC web site (SuomiNet) http://vortex.nsstc.uah.edu/mips/data/current/surface/ Water vapor PW sfc Condensed water
Phase changes and latent heating Latent heating is associated with a change of phase in water: water vapor liquid (cloud drops, rain drops) ice (ice crystals, ice precip.) Latent heating is the primary source of energy of thunderstorms Latent heating has profound effects on many atmospheric systems
Advanced concept Air density (r) • Number of air molecules per unit volume • Mass per unit volume: kg m-3 • Cannot directly measure density • Equation of state is used to calculate r • p=rRT or r = p/RT • R is the gas constant • Density is low on a hot day in Denver, CO • Density is high on a cold day in International Falls, MN
Wind Wind is the movement of air Wind is measured with anemometers Doppler radar/lidar/sodar Direction – defined as the direction from which the wind blows Speed – mph, knots, or m/s Symbols The importance of wind: Transports temperature and water vapor horizontally Strong winds produce damage
Relation between wind speed (V) and the pressure gradient (PG): V 1/PG Strong wind Weak wind Winds are stronger over the water surface (lower friction)
Automated Surface Observing System (NWS) Fig. 2A from Ch. 2
A question for thought • Is there a relation between temperature and pressure?
Homework • Test your problem solving skills, p. 17 • Numbers 2, 3


