Download
1 / 26
260 likes | 292 Vues
This study conducted by Heather, Brent, Karen, and Randy aimed to determine fish food sources in a pond, analyze zooplankton species and densities, identify macroinvertebrates, and examine fish stomach contents. The results showed differences in macroinvertebrate populations between pond sides, high rotifer densities, and a trophic cascade effect impacting zooplankton dynamics. The study suggested using more effective sampling methods and highlighted the need for further research on the pond ecosystem dynamics to enhance understanding.

E N D
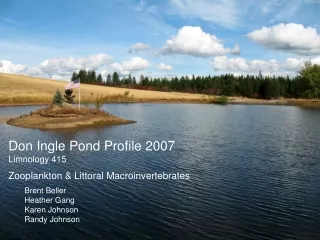
Don Ingle Pond Profile 2007Limnology 415 Zooplankton & Littoral Macroinvertebrates Brent Beller Heather Gang Karen Johnson Randy Johnson
Outline Introduction: Heather Methods: Brent Results: Karen Interpretation: Randy
Objectives To determine fish sources of food present in pond Zooplankton Identify zooplankton species present Determine densities of zooplankton at different depths and locations Macroinvertebrates Identify species present Compare population densities between East and West sides of the pond. Fish Analyze stomach contents to determine fish diet
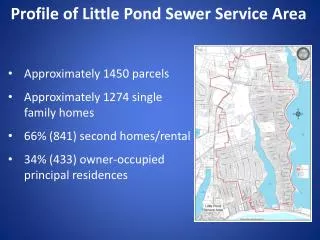
Background Mr. Don Ingle’s pond, located south of Kendrick, was built in 1995 and filled in 1996 Originally 14-16 feet (~4m) deep, currently approximately 8 feet deep (2.5m) Deepest point near dam on Eastern side Original area estimated at 2-3 acres Western third area of pond is shallower to attract waterfowl
Background Continued… • Original Fish Stocking • 1500 Trout (500 in three class sizes) • 50 breeding Bluegill • 50 Largemouth Bass • Excellent trout fishing for next 4-5 years • Successive Fish Stocking • 500 more Trout • 50 Smallmouth Bass • 250 Catfish • 250 Bullfrog tadpoles
Current Status • Cattails have invaded • ~100 dump truck loads have been removed to deepen the shoreline and remove cattails • Fishing has declined • Bluegills have white worms
Methods Yellow = Zooplankton Red = Macroinvertebrate
Methods • Macroinvertebrate Samples • Used D-net • Two locations • Midway between East end and dock • Far West end • Three 1.0 m passes • Depth of approximately 0.3 m at each location • Just above substrate
Methods • Macrovertebrate Identification • Used Dissecting microscope • Either counted entire sample or split sample into ¼ and estimated total
Methods • Fish Samples • Used stick seine net • Three areas • East of dock • At dock • West of dock
Methods • Zooplankton Samples • Used Schindler Trap • Two locations • East End (Deep) • 0.5, 1.5, 2.5 m • West End (Shallow) • 0.5 m
Methods • Zooplankton Identification/Counting • Added sample to dilution (50-85 ml) • 2 ml sample from dilution added to counting plate • Rotifers • Counted 2 squares • Average #/square then multiply by 59 (# squares/plate) • Counted entire plate for other zooplankton • Density (#/L) calculated using equations from previous lab
Macroinvertebrate Results • There were more macroinvertebrates in the West than the East • Oligochaeta were the dominant taxa with 846 counted • Ostrocoda was second with 440 counted • Little, if any, Baetidae, Caenidae, and Chaoborus sp. were found • High variance between replicates
Fish Sampling Results • Fish sampling • Only Young of the Year bluegill were found • No fish were caught which were large enough to analyze stomach contents
Zooplankton Results • Overview • West 0.5 m had the highest mean zooplankton density while East 2.5 m had the lowest • Rotifers were the most numerous zooplankton • Other zooplankton found included: Cyclopoids, Ceriodaphnia, and Daphnia
Zooplankton Results • There was approximately the same density of cyclopoids in all the East sites with East 2.5m having the lowest density • Daphnia and Ceriodaphnia had very low densities
Zooplankton Results • Rotifers were found in the highest concentration at the deepest location (East 2.5m)
Interpretation • No adult fish were captured • Small seine net • Poor footing • Inability to access deeper, preferred habitat • Other methods possibly more effective • Electroshocking • Gillnetting
Interpretation • Macroinvetebrate Samples • Possible errors in sampling (dist. above substrate) and identification lead to very high variances • Time constraints • Resulted in the inability to generate densities • Oligochaeta were the most abundant within the samples • Low species diversity • Most were found in the sediment and algae
Interpretation • Zooplankton • Rotifers • Very high densities observed within pond • After dilution were still too numerous to accurately count • Inaccurate estimation may have occurred due to uneven dispersal on the counting plate • Daphnia • Low densities observed • <10/L
Interpretation • High rotifer densities may be explained by a trophic cascade effect • Bluegill prey on daphnia • Daphnia prey on rotifers • High density of bluegill depresses daphnia, allowing rotifer densities to increase
Interpretation • No significant differences of mean zooplankton density found between locations or depths at an alpha of 0.05