Download
1 / 83
830 likes | 1.07k Vues
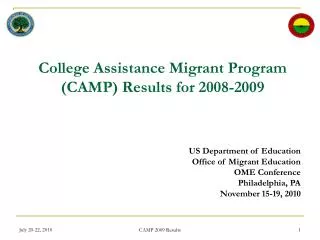
College Assistance Migrant Program (CAMP) Results for 2008-2009. US Department of Education Office of Migrant Education OME Conference Philadelphia, PA November 15-19 , 2010. Outline of Presentation. Introduction Solutions to Previous Years’ Challenges Assumptions and Limitations

E N D
College Assistance Migrant Program (CAMP) Results for 2008-2009 US Department of Education Office of Migrant Education OME Conference Philadelphia, PA November 15-19, 2010 CAMP 2009 Results
Outline of Presentation • Introduction • Solutions to Previous Years’ Challenges • Assumptions and Limitations • Research Assumptions • Research Limitations • Presentation of CAMP Data • “Top 10 Projects” for GPRA 1 & 2 Results • Summary and Conclusions • Next Steps CAMP 2009 Results
Introduction: “Why are we here?” Share CAMP 2009 APR program results 2009 “snapshot” data, using national CAMP data 2009 comparison data, using data from groups of CAMP projects 2006-2009 longitudinal data, using national CAMP data Recognize high performing projects After our session, share ideas for program improvement 3 CAMP 2009 Results
Top Reporting Issues from 2006-2008 • Persisters: The number of CAMP eligible students who completed intake, were enrolled and attending college courses, but did not complete their first year in college; and re-enrolled for continuing instructional services in support of completing their first academic year in the subsequent budget period. Placing persisters correctly in the APR was the most important reporting issue. • Over-Served: When CAMP projects served more students than they were funded, the GPRA 1 for projects could exceed 100%. 4 CAMP 2009 Results
Solutions to Issues of Persisters and Over-Served • Grantees carefully reviewed definitions and entered data within EMAPS for electronic Annual Performance Report (APR) with built-in “hints” for data quality checks. • Office of Migrant Education adjusted GPRA 1 formula… 5 CAMP 2009 Results
Adjusted GPRA Measure 1 Formula • Option A:For grantees who actually serve LESS than the number funded to be served or serve exactly the total number funded to be served: GPRA Measure 1= total no. of CAMP 1st academic yr. complet. [total no. funded to be served minus total no. of persisters] 6 CAMP 2009 Results
Adjusted GPRA Measure 1 Formula • Option B: For grantees who actually serve MORE than the number funded to be served: GPRA Measure 1=total no. of CAMP 1st academic yr. completers [total no. actually served minus total no. of persisters] 7 CAMP 2009 Results
Research Assumptions and Limitations • Assumptions: • Accurate data is entered by grantees on APR. • 100% fidelity to implementation of program objectives and corresponding services. • Limitations: • The total number of CAMP projects in this analysis is statistically small (36), and a more effective analysis will necessarily involve student-level data. 8 CAMP 2009 Results
Presentation of CAMP Data CAMP 2009 Results
Performance: Effective and Efficient • Overall performance on GPRA • Overall performance on efficiency measures • Additional CAMP research questions and results CAMP 2009 Results
National GPRA Measure 1 Data (Effectiveness): National Target MET! • The percentage of CAMP program participants completing their first year in college. • National Target = 86% of students complete their first year in college • 2008-2009 National Performance = 86% • The CAMP program, for the first time since 2006, and for the first time with accurate data, has met this national target! CAMP 2009 Results
National GPRA Measure 1 Data (Effectiveness): National Target MET! GPRA Measure 1 Y 24 Grantees 67% of allgrantees N 12 Grantees 33% of all grantees Sixty-seven percent of all CAMP grantees met the national target, up from 45% last year. This represents an increase of 22%! Let’s review the following slides, in order to explain these data... 12 CAMP 2009 Results
National GPRA Measure 1 Data (Effectiveness): National Target MET! GPRA 1 Formula, Option A. For grantees who actually serve LESS than the number funded to be served or serve exactly the total number funded to be served: Total no. of CAMP academic 1st yr. completers779 [Total no. funded to be served minus total no. (985-41) of persisters] 779 944 = 83% 13 CAMP 2009 Results
National GPRA Measure 1 Data (Effectiveness): National Target MET! • GPRA 1 Formula, Option B. For grantees who actually serve MORE than the number funded to be served: Total no. of CAMP 1st academic yr. completers767 [Total no. actually served minus total no. (905-51) of persisters] • 767 • 854 = 90% 14 CAMP 2009 Results
National GPRA Measure 1 Data (Effectiveness): National Target MET! National GPRA 1 Formula. No. of students funded in =/under-served CAMP projects = 985 (52% of total students) No. of students served in over-served CAMP projects = 905 (48% of total students) Total = 985 + 905 students, 1890 students 15 CAMP 2009 Results
National GPRA Measure 1 Data (Effectiveness): National Target MET! National GPRA 1 Formula. 83% (met GPRA 1 through Option A) * .52 (weighted value) = 43.16% 90% (met GPRA 1 through Option B) * .48 (weighted value) = 43.20% 43.16% (Served/Under-Served) + 43.20% (Over-served) 86.36%, or 86%. 16 CAMP 2009 Results
National GPRA Measure 1 Data 17 CAMP 2009 Results
National GPRA Measure 2 Data (Effectiveness): National Target MET! • The percentage of CAMP program first year completers who begin their second year in college. CAMP 2009 Results
National GPRA Measure 2 Data (Effectiveness): National Target MET! • National Target = 84% Performance = 91% • 1,413 Students continuing a second year 1,546 Students who completed their first year GPRA Measure 2 Y 33 92% N 3 8% 19 CAMP 2009 Results
National GPRA Measure 2 Data 20 CAMP 2009 Results
CAMP: How effective when compared to a comparable national program (TRIO)? • National Attrition Rate after 1st year: >25% at 4-year IHEs. • National Attrition Rate after 1st year: <50% at 2-year IHEs. CAMP 2009 Results
Cost per 1st Yr. Completer (Not Reported in PART) • Cost per 1st Yr. Completer is calculated as the total budget awarded for that budget period divided by the number of 1st Yr. Completers. Total CAMP Budget = Cost per 1st Yr. Completer No. of 1st Yr. Completers CAMP 2009 Results
Cost per 1st Yr. Completer (Not Reported in PART) No national targets yet. Total awarded $15,979,281 = Total No. 1st Yr. Completers 1,546 (Cost per 1st Yr. Completer): $10,336 CAMP 2009 Results
Cost per 1st Yr. Completer (Not Reported in PART) 24 CAMP 2009 Results
Efficiency Measure: Cost per 1st Yr. Completer that Continues (Reported in PART) • Cost per 1st Yr. Completer that Continues is calculated as the total budget awarded for that budget period divided by the number of students who cont’d into their second year of college. Total CAMP Budget = Cost per 1st Yr. Completer that continues No. of 1st Yr. Completers That Continue CAMP 2009 Results
Efficiency Measure: Cost per 1st Yr. Completer that Continues (Reported in PART) No national targets yet Total awarded$15,979,281 Total No. that Continue 1,413 (Cost per 1st Yr. Completer that Continues): $11,309 CAMP 2009 Results
Efficiency Measure: Cost per 1st Yr. Completer that Continues (Reported in PART) 27 CAMP 2009 Results
Number Funded and Number Actually Served • Total number funded to be served, per applications: 1775 • Total number actually served: 1808 • 102% students served, out of funded (increase of 13% in 2007-2008) CAMP 2009 Results
Number Funded and Number Actually Served CAMP 2009 Results
1st Yr. Completers and 2nd Yr. Continuers, Compared to Number Funded and Served • Longitudinal Data – “Tightening the Data Points” 30 CAMP 2009 Results
Is there a relationship between GPRA Measure 1 results and costs per 1st Yr. Completer? 31 CAMP 2009 Results
Is there a relationship between GPRA Measure 1 results and costs per 1st Yr. Completer? Correlation is significantly (p<0.01) negative. As higher percentages of students complete their 1st year, the costs per first year completer decline. 32 CAMP 2009 Results
What service models have the most positive outcomes for GPRA 1 and GPRA 2, and are the most efficient? Commuter vs. Residential Four Year vs. Two Year Small, Medium, and Large Projects What do we know about… Students requiring remediation The relationship between ACT/SAT scores and GPRA results The relationship between the percentage of English Learners (ELs) and GPRA results Other demographic/baseline data Office of Migrant Education Research Questions CAMP 2009 Results
Commuter/Residential/Combination 36 Total CAMP Projects Commuter: 12 Projects Residential: 12 Projects Combination of Commuter/Residential: 12 Projects 34 CAMP 2009 Results
Commuter/Residential/Combination (GPRA 1) • ANOVA (Analysis of Variance) compares the means of the three populations: • Commuter projects • Residential projects • Combination projects. • Do we see anything significant to the .05 level? 35 CAMP 2009 Results
Commuter/Residential/Combination (GPRA 1) 36 CAMP 2009 Results
Commuter/Residential/Combination (GPRA 1) 37 CAMP 2009 Results
Commuter/Residential/Combination (GPRA 1) • When we review the means (averages) of the three groups • Group 1 = Commuter • Group 2= Residential • Group 3 = Combination • What can we tell about the rates that groups of students tend to complete their first year of college? • Compared to last year? • No significant differences between groups • Commuter = lowest performing • Residential and Combination changed, with Combination now highest performing 38 CAMP 2009 Results
Commuter/Residential/Combination (GPRA 2) • Do we see anything significant to the .05 level? 39 CAMP 2009 Results
Commuter/Residential/Combination(GPRA 2) 40 CAMP 2009 Results
Commuter/Residential/Combination(GPRA 2) • When we review the means (averages) of the three groups • Group 1 = Commuter • Group 2= Residential • Group 3 = Combination • What can we tell about the rates that groups of students tend to complete their first year of college and continue? • Last year: Commuter: Low; Residential: High; Combination: Mid • What group has the most variation? 41 CAMP 2009 Results
Commuter/Residential/Combination (GPRA 2) Efficiency ***With one Residential CAMP removed, the cost efficiency for GPRA2 would be $13,019. 42 CAMP 2009 Results
Commuter/Residential/Combination (GPRA 2) Efficiency 43 CAMP 2009 Results
Commuter/Residential/Combination (GPRA 2) Efficiency • Commuters: From $12,097 to $9,455 • (Efficiency increased! Costs decreased by $2,642.) • Residential: From $13,558 to $14,451 • (Efficiency decreased. Costs increased by $893.) • Combination: From $13,171 to $10,955 • (Efficiency increased! Costs decreased by $2,216.) 44 CAMP 2009 Results
Four-Year v. Two-Year College Projects • 36 Total CAMP Projects • Four-Year: 27 Projects • Two-Year: 9 Projects 45 CAMP 2009 Results
Four-Year v. Two-Year College Projects(GPRA 1) Is there something significant that has happened? 46 CAMP 2009 Results
Four-Year v. Two-Year College Projects(GPRA 1) Are there differences in the means? 47 CAMP 2009 Results
Four-Year v. Two-Year College Projects (GPRA 2) Is there something significant that has happened? 48 CAMP 2009 Results
Four-Year v. Two-Year College Projects (GPRA 2) Are there differences in the means? 49 CAMP 2009 Results
Number and percentage of students requiring remedial coursework: 1177 Students required remedial coursework 1808 Number of students served = 65% require remedial coursework 50 CAMP 2009 Results