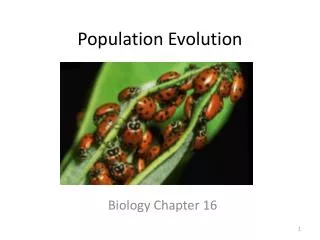
Population evolution
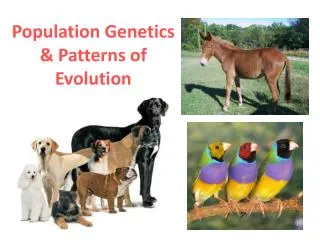
Population evolution. Size Density Dispersion. Properties of Population. Fundamental and important property of population but can be difficult to measure directly. Often too abundant, mobile, or widespread to count. Population size.

Population evolution
E N D
Presentation Transcript
Size • Density • Dispersion Properties of Population
Fundamental and important property of population but can be difficult to measure directly. • Often too abundant, mobile, or widespread to count. Population size
Population density is the quantity of individuals living in a particular space. Population Density
What would the data table for this look like? Population ProfileAKA: Age Structure
Type 1 What does each line say about the population? Type 2 Type 3 Survivorship curves Relative Age
Type 1: ex: humans: chances of death increase with age. • Type 2: ex: certain species of birds: probability of mortality does not change through out the lifespan. • Type 3: ex: sea turtles: chance of death is higher at younger ages. If they make it past this stage they stand a good chance to make it to old age. Survivorship curve
Growth = births – deaths • Increased life expectancy: childhood immunizations, vaccines, medications that prevent/maintain things like heart disease and diabetes, improved health care, etc. • This formula doesn’t take into account another factor of population growth: Immigration and emigration. • Mortality=death Population Influences
As long as births > deaths the population will grow • Even once births < deaths the population will take time to level off or decrease because of the base number of individuals who are of reproductive age. • Population also grows faster if the start of reproduction is at earlier ages. • Once the environment reaches the maximum number of individuals it can support (K=carrying capacity)the population will level off. • Not true of human populations…they make choices and can therefore change the dynamics of the graph. Exponential Population Growth
Any factor such as space which will limit the growth of an organism • All populations are ultimately limited by their environment. • The logistic growth model is similar to the exponential growth model except that it accounts for liming factors (carrying capacity=K) Limiting factor
Exponential growth curve K Logistic growth curve Limiting factor Exponential growth with and without “K”
Predator populations follows close pattern to prey. • If a new organism (for example another predator that is capable of eating the same prey) were artificially added the natural predator can be affected as can the prey population. • The new predator may eat more or less either dwindling the prey or causing it to “grow” out of control. Population Fluctuations
Density independent: Reduce the population by the same amount regardless of the size of the population • Fire, flood, weather. • Density dependent: an individual’s chance of surviving or reproducing depends on the number of individuals in the area. • Resources such as food, nesting space. Density Dependence
Small populations are more likely to be affected or even wiped out by such natural disasters as floods, fires, storms, or disease outbreaks. • Can lead to too few individuals to maintain the population. California Condor Perils of small populations
What scientists learned from this time period: • Small populations and high mortality rates lead to slow growth. • High infant and childhood mortality are especially high factors in slowing population growth because they never make it to reproductive age. Hunter/Gatherer Period
What happened during this period? • Agriculture greatly increased and stabilized food supplies. • Human populations began to grow faster. • People had more children • Needed more hands to work the farm • They weren’t as mobile so it made it easier to have more children. Agricultural revolution
After 1650: • Sharp decline in death rates because of improved sanitation, hygiene, control of disease, increased availability of food. • Birth rates remained high. Industrial Revolution
Environmental Issues Chapter 22 Section 2
What does this graph tell you? • Shows a correlation between CO2 and global warming. • Shows the concentration of CO2 in the atmosphere from 1880-2000. Global Warming
Evolution Lesson 15.1
Supported the idea that populations changed over time, but thought that acquired changes would be carried to the next generation. • Does a deer who looses an antler in a fight with another deer pass that “lost antler” trait on to the next generation? • Lemarck thought it did. • He also thought that individuals could acquire traits within their lifetime due to experience or behavior. • If you need fins, are you going to grow them? Lemarck
Proposed the theory of Natural selection • Organisms may possess traits that make them more suitable to their environment. Those individuals survive, pass on those traits to future generations. (survival of the fittest) • Requires genetic variation within a species. • Is the process that leads to evolution (natural selection over many generations) Darwin
Disruption of Genetic Equilibrium Lesson 16.2
Possible causes of disrupted genetic equilibrium: • Mutation • Immigration/emigration (migration) • Genetic drift • Traits change as a result of random events or chance • Happens more in smaller populations than in larger ones. • Artificial selection • Nonrandom mating • Small population size Causes of evolution
Many times mate selection is determined by geographic proximity. • May result in disorders caused by inbreeding. • Sometimes a mate is chosen because they possess similar traits: assortative mating. • Sexual Selection: In order to be selected by a mate, and leave offspring, an individual must possess extreme traits (like the plumage of a peacock) Nonrandom Mating
The “average” individual is best fit. • Consider the hypothetical situation of the lizard…Large ones may be more easily seen by predators, while small sized ones may be to slow to escaper predators…therefore it is the average sized individuals which may be best suited to the environment. Stabilizing Selection
Individuals with the extreme variation of a trait have a greater chance of survival than the one with the average variation. • Therefore individuals with short fat beaks and those with long narrow beaks would survive, but those with average length beaks die out on an island with flowers and nuts. Disruptive Selection
Individuals that display a more extreme form of a trait have greater fitness than an individual with an average trait. • For example when anteaters feed, they push their sticky tongue into the nest of termites. The longer the tongue the more fit the anteater. Directional selection
Formation of Species Lesson 16.3
The process of species formation that results in closely related species. • Some are very similar to their shared ancestor. Speciation
Proposed by Mayr, a species is an interbreeding population that cannot breed with other groups. Biological Species Concept
Geographic Isolation: Physical separation of members of a population. • When the original habitat becomes physically separated. • Reproductive Isolation: May sometimes arise through disruptive selection where the two extremes are selected for and as time passes, the two subpopulations can no longer interbreed. Isolation and Speciation
Gradualism: speciation occurs at a regular, gradual rate. • Punctuated equilibrium: Speciation occurs at a rapid pace. • What is rapid in evolution? • A few thousand years rather than a few million. Rates of Speciation
Two or more species become adapted to each other’s presence over a period of time Coevolution
Divergent: one species becomes two separate subpopulations. • Artificial selection has been used by humans to speed up this process. • Convergent: two species develop similarities even though they come from two very different ancestors.