Download
1 / 102
1.02k likes | 1.25k Vues
California Community Colleges Data Resources. Patrick Perry, Vice Chancellor of Technology, Research, and Information Systems California Community Colleges Chancellor’s Office. Who is this guy? Why should we listen to you?. Brad Pitt-like looks. Vin Diesel physique. And, I have an ENORMOUS…

E N D
California Community Colleges Data Resources Patrick Perry, Vice Chancellor of Technology, Research, and Information Systems California Community Colleges Chancellor’s Office
Who is this guy? Why should we listen to you? • Brad Pitt-like looks. • Vin Diesel physique. • And, I have an ENORMOUS… • …..database. • I collect data and measure stuff for a living. • I have all the data. • Information Management & Institutional Research: • IM…therefore IR.
My Credo • I realize that I will not succeed in answering all of your questions. Indeed, I will not answer any of them completely. The answers I provide will only serve to raise a whole new set of questions that lead to more problems, some of which you weren’t aware of in the first place. When my work is complete, you will be as confused as ever, but hopefully, you will be confused on a higher level and about more important things.
Today’s Learning Outcomes: • Learn how, why, and where data are collected • Learn how you can access this data • See some “golden nuggets” of data mining efforts • Understand accountability reporting for CCC’s • Know what new data tools are in the works
Technology, Research & Information Systems Data • Accountability Data/Reporting • Transfer Data • Data Mart • At the core of this is the MIS Data Collection system
MIS Data • Source: submissions from all 109 campuses/72 districts • End of term • Very detailed, unitary student and enrollment data • 1992-present • Data Element Dictionary online
Database Relationships Emp. Assign. EOPS DSPS Emp. Demo. Matric. Student Demographics (SB) VTEA Calendar Assignments Enrollments (SX) Sessions Sections PBS Pgm. Awds. Courses Fin. Aid Assess.
Data Uses • New and Continuing Students • Non-credit Matriculation • EOPS / DSPS Funding • EOPS/ DSPS Program Justification • VTEA (Vocational and Technical Education Act) • VTEA Core Indicator Reports • VTEA Allocations • BOGW Administrative Funding • Federal Integrated Postsecondary Education Data System (IPEDS) Reporting • CCC Data Mart
Data Clients • Legislative Analyst Office • Department of Finance • California Postsecondary Education Commission • Public Policy Institutes/Think Tanks • UC/CSU • Legislature – Committees and individual members • Community College Organizations • Newspapers • Labor Unions • Individuals
How Can I access the Data? • Data Mart – online • Reports – online • Ad-hoc report – call or email MIS • Ad-hoc request for unitary dataset • Must be approved by system office • Scrubbed of identifying fields • Usage agreement
Ad-Hoc requests • CO can cut reports or datasets, provided: • Student-identifiable information is not given • Request must have stated purpose and focus • Playing “what-if” is very time consuming
Data Mart (TRIS) • Demographics, FTES (not apportionment), awards, finaid, matric, assessment, student svcs progs, program retention/success, staffing reports • Demo
What’s Going on in CCC? Fee Impacts Budget Volatility California’s Changing Demography
CCC Trends • CCC now coming out of early 2000’s budget cuts and fee increases… • …headcounts are starting to creep back up… • …fees are stable (this week, at least)… • …and its all just in time for a demography crash.
CCC Pipeline • Coming in the door: • Early 2000’s: • Fee increases from $11-$18-$26, now $20 • Budget cuts • Pipeline issues now coming to fruition
The Big Pipeline Factor: The State Budget • California has a volatile tax revenue collection history • Very progressive taxation • State budgets negotiated late • College schedules set early • College CBO’s need stability; State provides little
The Budget • Downturns in revenue= • State: • Raising of fees • Enrollment prioritization • Local: • Expectation of cuts or no growth= • Immediately become fiscally conservative; OR • burn up your reserves THEN become fiscally conservative
Local Budget Reaction • Fall schedule set ~6 mo. beforehand • Budget frequently passed late, Fall term already begun • If budget=good, then little chance to add sections to capture • If budget=bad, then little chance to cut sections • In both cases, only Spring/Summer left to balance
Early 2000’s • Gray Davis came out with 10% budget reduction proposal in January 02 • CCC’s began creating Fall 02 schedules shortly thereafter • High anxiety and conservatism • Sections slashed • Final budget late in 02 • Cuts not nearly as drastic, but colleges already acted
Who Left? • High headcount loss, not so much in FTES • We lost a lot of single course takers • Enrollment priority to those already in system • Outsiders/first-timers-forget about getting your course • Fee Impact burden on older students
Why The Drop? • *The Children of Generation X • Gen X influence defined the 80’s-early 90’s culture (new wave music, big hair and shoulder pads) • Overeducated and underemployed, highly cynical and skeptical • Burdened by the societal debt of boomers • Extremely entrepreneurial (tech & internet)
Gen X Parents • More hands-on than Baby Boomer parents • Value higher education as more important to success than Boomer parents • Gen X is a much smaller cohort than Boomers; so are their offspring
Demography: Gender • 55% Female, 45% Male • Ratio hasn’t changed +/- 1% in 15 years
Demography of Success • “It is not so important who starts the game but who finishes it.” –John Wooden
Demography of Success • Does the group of students starting out or already in look like the students leaving with various outcomes? • Demography in=demography out • = parity.
Transfer Data • Located at CPEC website: • “Transfer Pathways” • Also in Accountability Report (ARCC), Research website • Demo
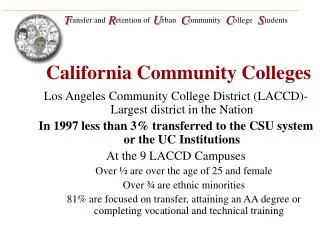
Importance of Transfer in BA/BS Production • High dependence on CCC transfers in BA/BS production at CSU/UC • CSU: 55%...and declining • UC: 28%...and steady • 45% of all BA/BS awarded from public institutions were from CCC transferees
Ten Years Ago… • Ten Years Ago: • We served 2.44 million students • 36% were underrepresented (AfrAm, Hisp/Latino, Filipino, Native Amer, Pac Isl) • Today: • We serve 2.62 million students • 42% are underrepresented (+6%) • Headcount has grown only 7% • Not much…and one might expect similar outcome parity…
However...Transfer • Ten Years Ago: • CSU Transfers: 44,943…UC: 10,177 • CSU Underrepresented: 28%...UC: 20% (+6%) • Today: • CSU Transfers: 54,379, UC: 13,874 • CSU Underrepresented: 34%...UC: 26% (+6%) • 24% increase in transfer volume (during a time when headcount went up only 7%) and achievement gap remained stable
But…Times are a-Changing… • Measuring Transfer
Transfer Measurement 101 • Method #1: Volumes • “How many students transferred in year X from CCC’s to other institutions?” • Method #2: Rates • “Of all the students who started in Year X, what % of them eventually transferred in X number of years?”
Transfer Volumes • Very common metrics: • Annual volume of transfers from CCC to CSU/UC • CSU: ~50,000 annually • UC: ~13,000 annually • In-State Private (ISP) and Out of State (OOS): ~13,000-15,000 annually each
Transfer Volumes • Annual volume of Transfers • CSU=somewhat volatile • UC=somewhat stable • Constrained by Enrollment Management at CSU/UC • 60/40, Fall/Spring admits, application deadlines • CSU/UC growth, FTES funding • CCC supply/pipeline • Functional barriers • Unconstrained in the open Educational marketplace • Few barriers, ability to absorb and respond
Tracking Transfers • Annual Volume of Transfers • CSU/UC: they provide these figures based on their criteria • We didn’t want to redefine this • In-State Private/Out of State: National Student Clearinghouse data match • Added another 30% to annual volumes • ISP/OOS transfer not “traditional”