Download
1 / 16
160 likes | 319 Vues
Evaluating Adverse Events after Vaccination in the Medicare Population. Robert Ball, MD, MPH, ScM Chief, Vaccine Safety Branch Division of Epidemiology CBER, FDA FDA/Industry Statistics Workshop September 29, 2006. Collaborators. CMS Lawrence La Voie, Peter Houck, Rebecca Hudson

E N D
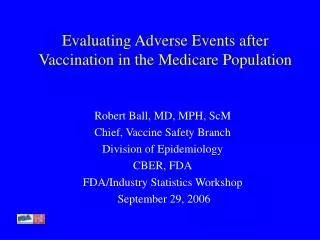
Evaluating Adverse Events after Vaccination in the Medicare Population Robert Ball, MD, MPH, ScM Chief, Vaccine Safety Branch Division of Epidemiology CBER, FDA FDA/Industry Statistics Workshop September 29, 2006
Collaborators • CMS • Lawrence La Voie, Peter Houck, Rebecca Hudson • FDA/CBER • Dale Burwen, Miles Braun
Medicare and Vaccine Safety: Background • Post-licensure observational studies using large linked databases can provide important data about whether adverse events are associated with vaccines. • Serious adverse events requiring hospitalization after vaccination are uncommon, but are important to evaluate to ensure safe vaccination and maintain the public’s confidence in vaccination. • Medicare data can help fill an important need because other databases may not have sufficient statistical power to examine rare events, and may under represent the elderly.
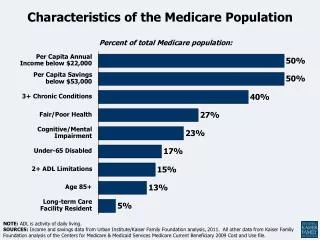
Medicare and Vaccine Safety: Background • ~ 41 million Medicare beneficiaries (96% of ≥ 65 year olds in US). • ~35 million ≥ 65 years old. • 6 million are younger with disabilities or end stage renal disease. • Key consumers of influenza and pneumococcal vaccines. • Nearly all of the elderly, and many younger beneficiaries, are recommended to receive the vaccines based on their high disease risk. • According to the CDC, routine revaccination of immunocompetent persons previously vaccinated with pneumococcal vaccine is not recommended, although revaccination once is recommended for certain persons provided that 5 years have elapsed since receipt of the first dose, and revaccination following a second dose is not routinely recommended. • Pneumococcal and influenza vaccination have been covered benefits in the Medicare program since 1981 and 1993, respectively.
Medicare and Vaccine Safety: Study Questions • Can Medicare data be used to evaluate adverse events after influenza and pneumococcal vaccines? • Is hospitalization for urinary tract infection (UTI), not likely associated with vaccination, or for cellulitis and abscess of the upper arm and forearm (CAUAF) associated with vaccination? • What are the data quality issues relevant to vaccine safety analyses?
Methods: Description of Study and Statistical Analysis • Case series design to evaluate the frequency of hospitalization during the period immediately after vaccination compared with the average frequency during the periods before and after vaccination. • Only persons who both were vaccinated and were hospitalized for the selected condition were included. • 7 days immediately preceding vaccination were excluded because of the healthy vaccinee effect; vaccinated persons are less likely to be acutely ill and hospitalized. • Determined the average frequency based on 54 days (days 8 to 30 prior to vaccination and days 0 to 30 after vaccination). • Tested whether the frequency of hospitalization deviated from a uniform distribution equal to the average frequency using the χ2 goodness-of-fit test. • If the observed frequency during the 54 days deviated from the uniform distribution, we tested whether the deviation localized to the week after vaccination by omitting days 0 to 7, and repeating the χ2 goodness-of-fit test for deviation from a uniform distribution. • Among the cohort of persons who received pneumococcal vaccine in 2001, we evaluated whether prior receipt of vaccine and shorter interval between vaccinations (<5 years) were risk factors for hospitalization for cellulitis and abscess of the upper arm and forearm (CAUAF). • Proportions were compared using χ2.
Methods: Data Quality Assessment • To assess agreement with other data sources, we compared vaccine coverage rates using Medicare claims data to published rates obtained from survey data including: • Agency for Healthcare Research and Quality’s (AHRQ) Consumer Assessment of Health Plan Surveys® (CAHPS) • CMS Medicare Current Beneficiary Survey (MCBS) • Centers for Disease Control and Prevention’s (CDC) National Health Information Survey (NHIS) • State-based Behavioral Risk Factor Surveillance System (BRFSS)
Methods: Data Sources • Data from the National Claims History File and Enrollment Database for 2001 • 2001 Medicare 5% sample and the 1991-2001 Pneumococcal Vaccine File
Interval Between Influenza Immunization and Admission Date for Selected Conditions Number of Hospitalizations Days before vaccination Days after vaccination Date of vaccination
Interval Between Pneumococcal Immunization and Admission Date for Selected Conditions Number of Hospitalizations Days before vaccination Days after vaccination Date of vaccination
Interval Between Receipt of Last Two Pneumococcal Vaccines, Among Persons Vaccinated in 2001 Number of Persons Years
TABLE 1. Influenza Vaccination Rates (per 100), Persons Age 65+, by Data Source Influenza Vaccination Rates (per 100), Persons Age 65+, by Data Source Abbreviations: CAHPS, Consumer Assessment of Health Plan Surveys; MCBS, Medicare Current Beneficiary Survey; NHIS, National Health Interview Survey; BRFSS, Behavioral Risk Factor Surveillance System; NA, published results not available.
TABLE 2. Pneumococcal Vaccination Rates (per 100), Persons Age 65+, by Data Source TABLE 1. Influenza Vaccination Rates (per 100), Persons Age 65+, by Data Source Pneumococcal Vaccination Rates (per 100), Persons Age 65+, by Data Source Abbreviations: CAHPS, Consumer Assessment of Health Plan Surveys; MCBS, Medicare Current Beneficiary Survey; NHIS, National Health Interview Survey; BRFSS, Behavioral Risk Factor Surveillance System; NA, published results not available.
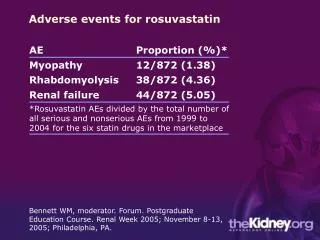
Conclusions • Using Medicare administrative data, we identified a possible increased risk of hospitalization for cellulitis and abscess of the upper arm and forearm after pneumococcal vaccine, but not influenza vaccine. • This risk of hospitalization was not detected in smaller studies. • Injection site reactions are likely to often be misdiagnosed as cellulitis. These data are consistent with the known local reactogenicity of pneumococcal vaccine. • The revaccination rate for pneumococcal vaccine is higher than expected and the interval of revaccination in some cases is shorter than expected (<5 years) based on current recommendations.
Conclusions • A potential limitation of Medicare data identified is the difference in vaccination rates between claims data and survey data. • This limitation can be addressed using the case series study design, where only individuals who have both the condition under study and received the vaccine are included. • Screening analyses can be performed using administrative data, but medical record review to validate diagnoses will often be needed for rigorous study of vaccine-adverse event associations. • Current and future projects include the evaluation of Guillain Barre Syndrome after influenza vaccine, cellulitis after pneumococcal polysaccharide vaccine, and pandemic influenza vaccine safety preparedness.
Distribution of vaccine claim dates, Medicare data, 5% sample, 2001 Percent Month