Initial Evaluation Design
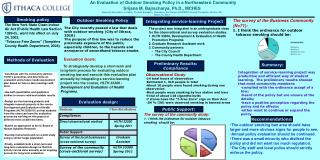
This study examines the effects of CDDRE participation on schools using a delayed treatment design. It compares treated schools with untreated schools matched on prior achievement, demographics, and urban/rural location. The research aims to determine the impact of CDDRE participation and the effectiveness of proven models.

Initial Evaluation Design
E N D
Presentation Transcript
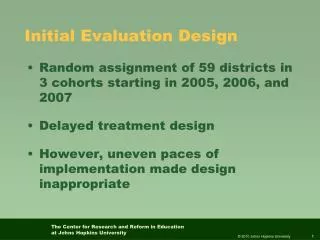
Initial Evaluation Design Random assignment of 59 districts in 3 cohorts starting in 2005, 2006, and 2007 Delayed treatment design However, uneven paces of implementation made design inappropriate
Comparisons with True Controls • Each school matched with untreated school in same state on: • Prior achievement • Demographics • Urban/rural • Schools followed up to 4 years • Data combined across states (z-scores)
Participating States Pennsylvania (28) Mississippi (4) Ohio (1) Indiana (2) Arizona (4) Tennessee (10) Alabama (2) 272 Elementary and 152 Middle Schools
Percentage of Schools Choosing a Reading Intervention Grade 5 2006 Cohort (3 years) 30% 2005 Cohort (4 years) 42% Grade 8 2006 Cohort (3 years) 28% 2005 cohort (4 years) 33%
Research Questions In comparison to non-CDDRE schools, what were the effects of CDDRE participation? How did effects vary for schools that did or did not choose proven models?
Conclusions A focus on data alone does not add to outcomes Implementation of benchmark assessments only moderately adds to outcomes What significantly adds to outcomes is adoption of proven school-level programs
Implications for Policy Focus on helping schools adopt proven programs • Review research on programs (as in BEE, WWC) • Provide incentives, assistance to use proven programs • Invest in creation of new programs (as in i3) • Invest in scale-up of proven programs (as in i3)