Physics and Whatcom
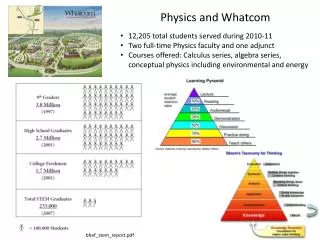
Physics and Whatcom. 12,205 total students served during 2010-11 Two full-time Physics faculty and one adjunct Courses offered: Calculus series, algebra series, conceptual physics including environmental and energy. bhef_stem_report.pdf.

Physics and Whatcom
E N D
Presentation Transcript
Physics and Whatcom • 12,205 total students served during 2010-11 • Two full-time Physics faculty and one adjunct • Courses offered: Calculus series, algebra series, conceptual physics including environmental and energy bhef_stem_report.pdf
The four balls belowhave been thrown straight up. They have the same size, but different masses. Air resistance is negligible. Rank in order, from largest to smallest, the magnitude of the acceleration of each ball at its maximum height. Some may be equal.
The Wave Problem Physicists: Displacement vs. Time graph is the change in position of the yellow dot from its equilibrium position with time Students: Displacement vs. Time graph is actually a Displacement in y vs. Displacement in x graph, i.e. a snap shot of the wave at a certain time Y Displacement X http://phet.colorado.edu/sims/wave-interference/wave-interference_en.jnlp http://www.acs.psu.edu/drussell/Demos/waves/wavemotion.html
The Time Domain (or lack thereof) • Students have trouble making the translation from observing cyclic phenomenon to the graphical representation of that phenomenon • Very little prior experience with graphical representation in the time domain • All graphs are x and y • Little understanding of the parameters graphed on the axes • Watching pendulums or springs oscillate and recording position vs. time using electronics does not aid in grasping/reading graphs • Some students, first experience with sine or cosine
How Ligo can Help • Seismometer is in a fixed location – students can see that it will not be driving down the road anytime soon • Have students look for periodic patterns • Periods of oscillations are longer scale – students are able to correlate with more macroscopic events
Student Analysis • Determine periods using classroom software • Come up with models to explain source of oscillations, try to correlate online data with seismic data