Download
1 / 7
70 likes | 93 Vues
The Snow Water Equivalent (SWE) model provides spatially distributed snowmelt data using remotely sensed meteorological inputs based on the Utah Energy Balance snowmelt model. Access daily SWE maps showing snow pack water content distribution and snow depth for irrigation planning. Learn more at the FEWS.NET Afghanistan website. Explore snow water volume estimates for dam basins and seasonal comparisons through updated charts. Gain insights on possible snowmelt flooding hazards with SWE model outputs.

E N D
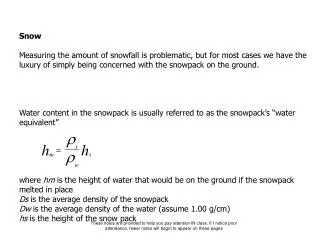
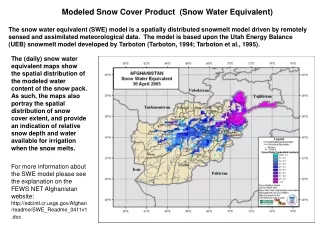
Modeled Snow Cover Product (Snow Water Equivalent) The snow water equivalent (SWE) model is a spatially distributed snowmelt model driven by remotely sensed and assimilated meteorological data. The model is based upon the Utah Energy Balance (UEB) snowmelt model developed by Tarboton (Tarboton, 1994; Tarboton et al., 1995). The (daily) snow water equivalent maps show the spatial distribution of the modeled water content of the snow pack. As such, the maps also portray the spatial distribution of snow cover extent, and provide an indication of relative snow depth and water available for irrigation when the snow melts. For more information about the SWE model please see the explanation on the FEWS NET Afghanistan website: http://edcintl.cr.usgs.gov/Afghan/readme/SWE_Readme_0411v1.doc
Snow Water Equivalent Volume Estimates Snow Water Equivalent (SWE) volume estimates were created for selected basins above known dam locations. Each cell of the daily SWE grids (with units of depth) was multiplied by its area to obtain water volume estimates. Basin-level statistics were calculated to create tables summing up the total volume in each of the reservoir basins. An Access database is updated daily with new totals for snow water volume, and new time series charts are produced in Excel to provide a seasonal comparison (e.g., 2005, 2004, 2003). The charts for specific sub-basins can be selected from a map of 16 known dam locations throughout Afghanistan
Snow Water Volume Charts The Snow Water Equivalent (SWE) model produces uncalibrated estimates of snow water equivalent – since data for calibration are not available in Afghanistan at the current time. Thus, snow water volumes derived from the SWE model can be used to make relative comparisons between seasons, although the values should not be regarded as absolute. The Snow Water Volume charts are designed to provide insight into where flooding hazards due to snowmelt might exist.
Afghanistan’s Sistan Wetlands Time Series Analysis A 3-year time series analysis of the Sistan Wetlands was completed for the years 1989 through 1991 in an effort to characterize the Helmand River flood of February 1991. SPOT imagery was acquired for August 12, 1991, the earliest available date after the flood event. The SPOT images are panchromatic (single band, black and white) with 10-m spatial resolution. The SPOT imagery was used to train and validate results from the much coarser resolution 1-km AVHRR data available historically on a daily basis. AVHRR scenes were selected based on date and cloud cover. One scene was selected for each month between 1989 and 1991 for a total of 36 scenes.
The SPOT image was clipped to a screen-digitized water boundary because it was more effective than deriving an water-only classification from the panchromatic image. 10-m pixel resolution provides reasonable accuracy. Areas within the original water boundary that revealed a large variety in unique pixel values were then considered mixed water/land pixels. Road The grid was then reclassified such that pure (water or land) pixels were distinguished from the mixed pixels. A “Percent Water” grid was created by assigning each mixed pixel a %water value, determined from the ratio of land (0) to water (1).
The surface area of water from the SPOT image was determined by the equation: • (%h2o) * (cellsize)2 * (pixel count), where %h2o is the percent water for each pixel from the “Percent Water” grid. • The calculated surface area for the Hamoun-e Saberi and the Daryache-ye Sistan water bodies on 12 Aug 1991 is 2834 km2. • The volume of the 2 lakes was determined according to: • (max. lake elevation – pixel elevation) * (cell size)2 * (%h2o), • with the condition: if (pixel elevation) > (max lake elevation), then the depth = 0.5 meters. • The volume of the 2 lakes on 12 August 1991 was calculated to be 3.1269 km3 (or bcm, billion cubic meters).