Bermuda Bio-Optics Project: Insights into Ocean Color and Underwater Light Dynamics
The Bermuda Bio-Optics Project (BBOP) has provided over three decades of vital data on the underwater light environment in the Sargasso Sea, focusing on processes that control ocean color. Key achievements include advancements in algorithm development, calibration of sensors, and extensive time-series data on chlorophyll concentration, primary productivity, and the dynamics of colored dissolved organic matter (CDOM). This project highlights the interannual trends and seasonal patterns affecting oceanic ecosystems, contributing valuable knowledge to the fields of oceanography and climate science.

Bermuda Bio-Optics Project: Insights into Ocean Color and Underwater Light Dynamics
E N D
Presentation Transcript
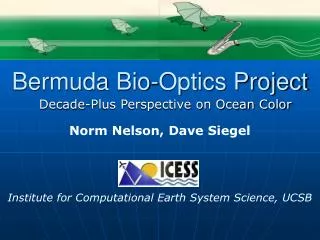
Bermuda Bio-Optics Project Norm Nelson, Dave Siegel Institute for Computational Earth System Science, UCSB Decade-Plus Perspective on Ocean Color
Bermuda Bio-Optics Project • OverviewScience GoalsData StreamsAccomplishments • A Look at the Time Series
Bermuda Bio-Optics ProjectOverview - Main Science Goals • Understand processes controlling underwater light environment in the Sargasso Sea • Algorithm development(With Stéphane Maritorena) • Calibration and validation of ocean color sensors
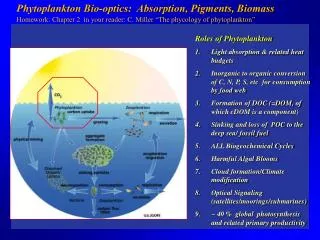
Bermuda Bio-Optics ProjectOverview - Main Science Achievements • Light, primary productivity, and photosynthetic quantum yield • Distribution and dynamics of CDOM(Sargasso Sea and global) • Photochemistry and DMS cycling
Bermuda Bio-Optics ProjectOverview - Data Streams • Time-series co-located with BATS(32N 64W), starting in 1991Also - frequent regional studies • Core Measurements:Ed, Es, Lu(7-14l, BSI & Satlantic radiometers)[chl a] (fluorometric)Since 1994:ap,ad(QFT)acdom(conventional UV-Vis spectroscopy)
Bermuda Bio-Optics ProjectOverview - Data Streams • Concurrent data from the BATS ProjectHydrographyCarbon (inorganic, organic)NutrientsPrimary ProductionC and N flux (sediment traps)Phytoplankton pigments (HPLC) • Other BBOP data (not full time-series)AC-9 absorption coefficient profilesLw(0+), ASD FieldSpec radiometerLsun, Microtops sunphotometer
Bermuda Bio-Optics ProjectOverview - Data Streams • Radiometer calibration: in house, using NIST-traceable standards, participated in SeaWiFS and SIMBIOS intercomparisons: Same engineer for entire project (Dave Menzies)
Bermuda Bio-Optics ProjectRadiometry – 14 year time series 441 nm (MER) 441 nm (MER) 443 nm (SPMR)
Bermuda Bio-Optics ProjectAbsorption Coefficient – 10 Year Time Series • Absorption Coefficient ComponentsCDOMPhytoplanktonDetritusPhytoplankton absorption ratios (440/674nm) • Are there interannual or longer term trends in addition to already-documented seasonal patterns?
BATS CDOM Profile STMW Surface Bleached Layer STMW (18° Water) Main Thermocline
CDOM exhibits seasonal and interannual variability Possible teleconnection to climate oscillators (NAO shown)
Control of CDOM at BATS • Annual: Balance between local production and solar bleaching • Interannual: Multi-year accumulation at depth and ‘resetting’ by deeper winter mixing (similar to DOC patterns)
Absorption by Phytoplankton • Phytoplankton pigments dominate absorption (detrital contribution small, correlated with phytoplankton) • Strong seasonal cycle related to spring bloom • Seasonal change in absorption properties related to photoadaptation and seasonal succession of phytoplankton species • Primary production variability has been linked to climate oscillators such as ENSO
Trends in Absorbing Components at BATS • CDOM abundance governed in part by physical processes possibly teleconnected to climate oscillators • Phytoplankton abundance and species succession has not varied along the same time scales
Conclusions (so far) • The BBOP time series is enabling us to observe and diagnose ocean color variations occurring on climate-oscillator time scales. • CDOM abundance apparently responds on these time scales • So far we are not seeing this in a dramatic way with the phytoplankton community
Acknowledgments • Ocean Biology and Biogeochemistry Program, NASA • Collaborators I’ve not mentioned (there are many, thank you) • BBOP and BATS Project technicians, engineers, and students over the years (I could fill several slides)