Download
1 / 6
70 likes | 223 Vues
Fraser River Pink Salmon Stock Assessment Program. Brad Fanos and Tracy Cone Stock Assessment, Lower Fraser Area Fisheries and Oceans Canada 100 Annacis Parkway Delta BC V3M 6A2. The Stocks.

E N D
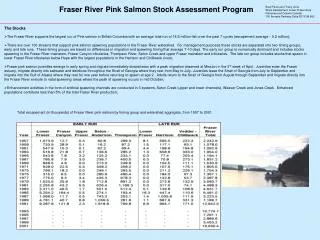
Fraser River Pink Salmon Stock Assessment Program Brad Fanos and Tracy Cone Stock Assessment, Lower Fraser Area Fisheries and Oceans Canada 100 Annacis Parkway Delta BC V3M 6A2 The Stocks • The Fraser River supports the largest run of Pink salmon in British Columbia with an average total run of 14.5 million fish over the past 7 cycles (escapement average - 9.2 million); • There are over 100 streams that support pink salmon spawning populations in the Fraser River watershed. For management purposes these stocks are separated into two timing groups, early and late runs. These timing groups are based on differences in migration and spawning timing that average 7-10 days. The early run group is numerically dominant and includes stocks spawning in the Fraser River mainstem, Fraser Canyon tributaries, Thompson River, Seton Creek and upper Fraser mainstem and tributaries. The late run group includes stocks that spawn in lower Fraser River tributaries below Hope with the largest populations in the Harrison and Chilliwack rivers; • Fraser pink salmon juveniles emerge in early spring and migrate immediately downstream with a peak migration observed at Mission in the 3rd week of April. Juveniles enter the Fraser estuary, migrate directly into saltwater and distribute throughout the Strait of Georgia where they rear from May to July. Juveniles leave the Strait of Georgia from July to September and migrate into the Gulf of Alaska where they rear for one year before returning to spawn at age 2. Adults return to the Strait of Georgia from August through September and migrate directly into the Fraser River enroute to natal spawning areas where the peak of spawning occurs in mid October; • Enhancement activities in the form of artificial spawning channels are conducted in 3 systems, Seton Creek (upper and lower channels), Weaver Creek and Jones Creek. Enhanced populations contribute less than 5% of the total Fraser River production; Total escapement (in thousands) of Fraser River pink salmon by timing group and watershed aggregate, from 1957 to 2001.
Fraser River Pink Salmon Stock Assessment Program Brad Fanos and Tracy Cone Stock Assessment, Lower Fraser Area Fisheries and Oceans Canada 100 Annacis Parkway Delta BC V3M 6A2
Fraser River Pink Salmon Stock Assessment Program Brad Fanos and Tracy Cone Stock Assessment, Lower Fraser Area Fisheries and Oceans Canada 100 Annacis Parkway Delta BC V3M 6A2 Assessment of Juvenile Abundance • Location: Mission, BC (above tidal influences and below major spawning areas); • Sampling Period: usually early March to late May (depending on catch and spring freshet); • Sampling gear: two traps attached to either side of a 33 foot gill net boat; a mobile trap and a vertical trap; • Sampling Methods: trapping occurs every second day, with the sampling period alternating between 8 and 24 hours. Traps are set for a 15 minute sampling period with the vertical trap operating sequentially at 6, 9 and 12 foot depths. The boat is manoeuvred to sample sequentially at three stations across the width of the river. The catch for each set is identified, counted and released; • Biological samples: Twenty-five pink fry are sampled and preserved in formalin every 8 hour shift; • Estimation procedure: Catches are stratified by depth, gear type and sample period. Average catches are generated and scaled by time and discharge to calculate daily (24 hour) abundance estimates. Estimates are calculated for each sampling day and interpolated for non-sampling days. Mobile Trap: 4-foot by 4-foot inclined plane trap which samples the surface 40 inches of the water column. Vertical Trap: consists of a surface trap (similar to the mobile) and a movable vertical section (fyke net) which can be positioned to any depth to 12 feet.
Fraser River Pink Salmon Stock Assessment Program Brad Fanos and Tracy Cone Stock Assessment, Lower Fraser Area Fisheries and Oceans Canada 100 Annacis Parkway Delta BC V3M 6A2 Adult Escapement Enumeration • From the early 1900’s to 1957 information on Fraser River pink salmon abundance is sporadic, based primarily on Fishery Officer observations; • The International Pacific Salmon Fisheries Commission (IPSFC) developed a framework for assessing Fraser River pink salmon using intensive stock specific enumeration programs involving a combination of mark-recapture and visual survey methods. The major tributary populations were estimated from individual mark-recapture studies and the Fraser mainstem population estimated by tagging fish in the lower Fraser River at Duncan Bar and recovering carcasses throughout the watershed. The majority of the smaller tributary populations were systematically assessed using visual methods. This escapement estimation system was used by the IPFSC from 1957 to 1985 and was adopted by DFO in 1987 and continued until 1991; • In 1993, a major review of the Fraser River Pink salmon escapement estimation system occurred resulting in: a) the termination of all stock-specific tributary mark-recapture studies; and b) the implementation of a system capture-live recapture program in the lower Fraser River with the objective of estimating system-wide escapement. From 1993 to the present Fraser Pink salmon escapement has been estimated for the entire Fraser River system using the capture-live recapture program. Capture- Live Recapture Program Methods: • Tagging - Migrating pink salmon are captured in the lower Fraser near Fort Langley (Duncan Bar), tagged and then released. Each captured fish is identified with all pink salmon sexed, assessed for external marks, measured (fork length) and a sample of females assessed for fecundity. Tag application is initiated in late August and continues daily through to early October. Sampling effort is standardized over an eight hour period with 8-9 sets made per day. • Live Recapture - Migrating pink salmon are subsequently recaptured at a site 22 km upstream from Mission (Strawberry Island) from late Aug to early Oct. Sampling effort is standardized over a 24-hr period with 33 sets made per day. Each fish in the live recaptured sample is assessed for marks and released. Both the tagging and live recapture sites are below spawning areas and above the major commercial net fisheries.
Fraser River Pink Salmon Stock Assessment Program Brad Fanos and Tracy Cone Stock Assessment, Lower Fraser Area Fisheries and Oceans Canada 100 Annacis Parkway Delta BC V3M 6A2 Testing of mark-recovery assumptions: Closure assumption is violated at the tagging site as sampling effort is restricted to an eight-hour period during daylight hours. As a result, large diel components of the daily migration are not vulnerable to tagging. Closure at the live-recapture site is achieved as sampling effort is conducted 24-hours per day through the entire migration period. Since, all components of the run are vulnerable in one of the two samples (live-recapture) no significant violation of the closure assumption occurs; The mark loss is assessed by applying a permanent secondary mark (opercular hole punch) to all marked fish. Mark loss is assessed on each program with results from 1995 to 2001 showing very low loss rates (average below 0.6%); Mark recognition at the live recapture site is considered to be reliable and with virtually no mark misidentification error identified in recent studies; The effects on handling and tagging stress on the behaviour of fish subsequent to their release is assessed for each program. Studies are designed to minimize handling stress during the capture and tagging processes. Acute handling stress is assessed by conducting regular carcass recovery surveys below the tag site to assess the proportion of marks in the recovered carcass sample. Recovery rates for recaptured tagged fish and migration rates are compared to assess the potential affects of handling stress. In recent studies, no significant effect of handling stress has been observed; The assumption of simple random sampling and equal probability of capture and recapture is violated in virtually all mark-recapture studies. The live recapture study attempts to address these concerns by designing capture and recapture sampling to be as representative as possible. Both tag application and live recaptured samples are assessed for sampling bias to evaluate impacts on the population estimate. Sampling bias (temporal) has been observed on all studies analyzed to date, however, the observed bias is inconsistent between the two samples suggesting that the sources of selectivity are independent. • Population Estimates • The gross escapement of pink salmon to the Fraser River system is calculated for sexes separately using capture-live recapture data adjusted for tag loss and handling stress; • Three population estimates are calculated using SPAS (Arnason et al. 1986) the pooled Petersen estimator, the Darroch maximum likelihood estimator and the Schaefer estimator; • The pooled Petersen has consistently been accepted as the best estimate for all Fraser River Pink live-recapture programs conducted since 1995. Precision around the estimate is consistently below the desired management level of +/- 25%.
Fraser River Pink Salmon Stock Assessment Program Brad Fanos and Tracy Cone Stock Assessment, Lower Fraser Area Fisheries and Oceans Canada 100 Annacis Parkway Delta BC V3M 6A2 Escapement and Survival Trends Freshwater (red line) survival is calculated using total female escapement, average fecundity and Mission fry abundance data. Marine (blue line) survival is calculated using brood year Mission fry abundance estimates and the subsequent total return (catch and escapement) data.


![Agency Coordination: Fraser River Estuary Management Program [FREMP] 1985-2003](https://cdn2.slideserve.com/3753298/agency-coordination-fraser-river-estuary-management-program-fremp-1985-2003-dt.jpg)


![Agency Coordination: Fraser River Estuary Management Program [FREMP] 1985-2003](https://cdn5.slideserve.com/9431797/agency-coordination-fraser-river-estuary-management-program-fremp-1985-2003-dt.jpg)