Fish Stock Assessment for Sustainable Fisheries Management
240 likes | 678 Vues
This core course, FIS 715, delves into the science of fish stock assessment, essential for sustainable fisheries management. Covering topics like biostatistics, catch assessment, growth parameter estimation, and maximum sustainable yield, students will learn the critical role of scientific data in managing aquatic resources. By integrating biological processes and fishing operations, the course underscores the importance of understanding fish stocks' dynamics to inform policy and ensure long-term ecological balance. Join us in shaping sustainable fishing practices.

Fish Stock Assessment for Sustainable Fisheries Management
E N D
Presentation Transcript
Mrs Nafisat Bolatito IKENWEIWE (PhD)DEPARTMENT OF AQUACULTURE AND FISHERIES MANAGEMENTUNIVERSITY OF AGRICULTURE, ABEOKUTA FISH STOCK ASSESSMENT titobola2007@yahoo.com, 08033770265
FISH STOCK ASSESSMENT FIS 715 (3 UNITS) CORE COURSE
Course outline • Biostatistics. • Catch assessment and frame survey. • Estimation of growth parameters. • Sampling commercial catches. • Estimation of maximum sustainable yield. • Multi species/Multi fleet problems.
Biostatistics • This a contraction of biology and statistics; sometimes referred to as biometry or biometrics, • It is the application of statistics to a wide range of topics in biology.
The science of biostatistics encompasses • the design of biological experiments (especially in medicine and agriculture); • the collection, summarization, and • analysis of data from those experiments; • the interpretation of, and • inference from, the results
Background to Fisheries • Fisheries are based on stocks of wild aquatic animals living in their natural environment (Oceans, seas, lakes, rivers, swamps) • The fisheries depend entirely on the state of the fish stocks • Management of fisheries require scientific advice about the state of the fish stocks • Fisheries science is concerned with provision of this advice
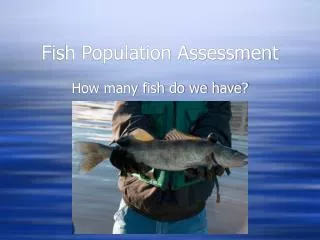
The role of stock assessment in fisheries management • To provide what is in the resource envelope (How much fish is available, composition, distribution, and population structure) • How much is being harvested using which type of gears • To provide advice on optimum exploitation of a fishery • To predict consequences of various levels of fishing effort on yield and biomass
Basic elements of a fishery • The standing stock (biomass) • the input (fishing effort) • the output (fish landed) • the processes that link input and output (the biological processes and fishing operations)
The fish stock assessment process • Fish stock assessment aims at describing the link between input and output using models. INPUT PROCESS OUTPUT (observation) (model) (observation) • Biological and technical data on the fisheries are required • These data are obtained by sampling the catches of commercial fisheries and research fishing surveys • Fishery survey data are processed together to provide managers and policy makers with advice on exploitation/utilisation of aquatic resources.
Terminologies • Underexploited: Undeveloped or new fishery. Believed to have a significant potential for expansion in total production; • Moderately exploited : Exploited with a low level of fishing effort. Believed to have some limited potential for expansion in total production; • Fully exploited: The fishery is operating at or close to an optimal yield level, with no expected room for further expansion;
Overexploited : The fishery is being exploited at above a level which is believed to be sustainable in the long term, with no potential room for further expansion and a higher risk of stock depletion/collapse; • Depleted: Catches are well below historical levels, irrespective of the amount of fishing effort exerted; • Recovering: Catches are again increasing after having been depleted
Snapshot of the global situation • Of the 600 marine fish stocks monitored by FAO (2003): • 3% are underexploited • 20% are moderately exploited • 52% are fully exploited • 17% are overexploited • 7% are depleted • 1% are recovering from depletion
What Can Stock Assessment Tell Us? • What is in the resource envelope? • how much fish is available, • what is the potential productivity • distribution • population structure • How much is being harvested using which type of gears • To predict consequences of different harvest strategies • To provide advice on policy formulation and management plans for the long-term sustainability of the fishery Source:www.fao.org
Basic Elements of a Fishery • The standing stock (biomass) • The input (fishing effort) • The output (catch) • The processes that link input and output • Biological processes • Fishing operations Source:www.fao.org
Control Measures and Fishing Capacity Input Standing Stock & Processes Output No. of vessels Vessel size Fishing time Minimum size Meash size Gear type TAC Bag limit Bycatch limit Fishing Capacity Overcapacity vs Over-exploitation Source: FAO (1999), Arrizabalaga et al. (2009)
The Role of Stock Assessment in Fishery Management Fishing activity Data collection Stock Assess. Advice (SAG) Regulations Policy Formulation (SAC) Fish stock Source:www.fao.org
Indicators of Stock Abundance for Fishery Management Purposes • Landings < 50% of the peak-5 years’ average without a clear cut in effort • Abundance indices < 50% of the initial values (catch rates of commercial or research vessels) • Fishing mortality >natural mortality (length-based methods) • The use of indicators involves a great uncertainty • Such uncertainties can be dealt with by adaptive approaches for management purposes, but using indicators to determine sustainability is much more difficult as it requires a clear Reference Value www.fao.org
Further Readings • Halls, A.S., Arthur, R., Bartley, D., Felsing, M., Grainger, R., Hartmann, W., Lamberts, D., Purvis, J., Sultana, P., Thompson, P. Walmsley, S. (2005) Guidelines for Designing Data Collection and Sharing Systems for Co-Managed Fisheries. Part 1: A Practical Guide. FAO Fisheries Technical Paper. 494/1. Part II: Technical Guidelines. FAO Fisheries Technical Paper. 494/2. Rome, FAO. • Ita E. O. and M. Mdaihli (1997). The Current Status Of Fish Stock And Fisheries In Kainji Lake