Download
1 / 75
750 likes | 886 Vues
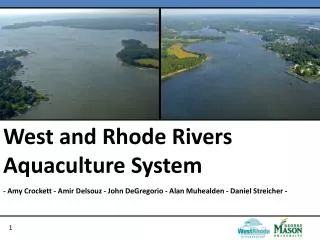
West and Rhode Rivers Aquaculture System. - Amy Crockett - Amir Delsouz - John DeGregorio - Alan Muhealden - Daniel Streicher - . Agenda. Context Analysis Problem Statement Stakeholder Analysis Statement of Need Design Alternatives/Questions Method of Analysis/Simulation

E N D
West and Rhode Rivers Aquaculture System - Amy Crockett - Amir Delsouz- John DeGregorio- Alan Muhealden- Daniel Streicher -
Agenda • Context Analysis • Problem Statement • Stakeholder Analysis • Statement of Need • Design Alternatives/Questions • Method of Analysis/Simulation • Project Plan/Budget
West and Rhode Rivers (WRR) • Two sub-estuaries of the Chesapeake Bay • Contain 26 million cubic meters of water, average depth is 2 meters. • Watershed covers 78 square kilometers (J. Askvig et al. 2011) Rhode Fairfax West Chesapeake Bay Context Analysis
Eutrophication Process Excess Nutrients Algae Bloom Increased Turbidity SAV* Growth Prevented Hypoxic Conditions Aquatic Species Mortality Data Source: West/Rhode Riverkeeper Report Card 2011 * SAV = Sub Aquatic Vegetation Context Analysis
Current Water Quality of WRR Data Source: West/Rhode Riverkeeper Report Card 2011 Context Analysis
Earlier Sponsorships • Previous project established three alternatives to decrease turbidity and increase SAV growth (Askvig et al, 2010) • Soft Shell Clams (Proposed Solution) • Oysters • Living Shoreline Restoration Context Analysis
Earlier Sponsorships Continued • Pilot project by Smithsonian Environmental Research Center Summer 2011 • All of the clams died: close to survivability limits (Gedan, 2011) • Oysters are known to be more resilient to varying salinity and dissolved oxygen conditions, propose to use oysters in order to improve water quality. Context Analysis
Salinity Tolerance Data Source: Maryland Department of Natural Resources Context Analysis
Agenda • Context Analysis • Problem Statement • Stakeholder Analysis • Statement of Need • Design Alternatives/Questions • Method of Analysis/Simulation • Project Plan/Budget
Problem Statement The WRR has decreased water quality due to increased nutrients and sediment from runoff and is exacerbated by loss of Sub-Aquatic Vegetation (SAV) and other aquatic resources. 14.4% Diff Data Source: Maryland Department of Natural Resources Problem Statement
Agenda • Context Analysis • Problem Statement • Stakeholder Analysis • Statement of Need • Design Alternatives/Questions • Method of Analysis/Simulation • Project Plan/Budget
Primary Stakeholders 1. West/Rhode Riverkeeper 2. Watermen 3. Maryland Department of Natural Resources 4. Watershed Residents Stakeholder Analysis
West and Rhode Riverkeeper • Supports stopping pollution, enforcing environmental law, promoting restoration, and advocating for better environmental policy. (W/R Riverkeeper, 2010) • Monitors water quality • Performs community outreach Goal: Increase the water quality of W/R Rivers Stakeholder Analysis
Watermen • Supports harvesting and sale of aquatic species throughout the year. • Estimated Salary: $8/hour ($18,000-36,000/year) (Wieland, 2007) • In the past two decades, working oystermen on the bay have dropped to less than 500, from 6,000. (New York Times, 2008) Goal: Make a profit Stakeholder Analysis
Oyster Aquaculture Result of Overharvesting Presence of P. Marinus (Dermo) Source: Maryland Department of Natural Resources [8] Stakeholder Analysis
Maryland Dept. of Natural Resources • Supports management of regional watershed, which includes streams, coastal bays, and the Chesapeake Bay. • Provides regulation for shellfish harvesting • Funds state hatcheries, provides aquaculture training, and subsidizes loans Goal: Environmental protection and increasing employment through aquaculture Stakeholder Analysis
Residents • Supports recreational use of river and waterfront property use. • Provides public support for environmental cause. • Also source of waste runoff and nutrient pollution. (W/R Riverkeeper, 2010) Goal: Support clean environment Stakeholder Analysis
Stakeholder Relationship Diagram Consumers Residents Supports and Funds Pays Taxes Aquaculture Market Waste Runoff W/R Riverkeeper Recreation Informs and Promotes Restoration Market Sales Market Revenue West and Rhode Rivers Harvests Resources Supports and Monitors Supplies Aquaculture Watermen Pays Taxes Supports Conservation MDDNR Support Aquaculture and Regulates Licenses Advocates Policy Change Reinforcement Loop Stakeholder Analysis
Agenda • Context Analysis • Problem Statement • Stakeholder Analysis • Statement of Need • Design Alternatives/Questions • Method of Analysis/Simulation • Project Plan/Budget
Statement of Need There is a need for a system which will increase the secchi depth of the West and Rhode River to at least 1 meter and will be financially sustaining netting at least $36,000 per year in 5 years. Source: MDDNR Water Quality Monitoring [1] Statement of Need
Win-Win Solution • Oysters have potential to filter 190 liters of water per day depending on environmental variables • Implementation of oyster aquaculture in the WRR will reduce turbidity • Aquaculture opportunities for employment of watermen Statement of Need
Originating Requirements 1.0 The system shall increase the secchi depth of the WRR to at least 1 meter. 2.0 The system shall produce a profit of at least $36,000 per year. 3.0 The system shall have a return on investment in 5 years. Statement of Need
Scope • Simulation of oyster growth rate within the varying environment of the West and Rhode Rivers. • Simulation of an oyster aquaculture business plan. • Measurement of nutrient levels within the West and Rhode Rivers, specifically the effect of Oysters as a filtration source. Statement of Need
Agenda • Context Analysis • Problem Statement • Stakeholder Analysis • Statement of Need • Design Alternatives/Questions • Method of Analysis/Simulation • Project Plan/Budget
Design Alternatives • Stage 1: Obtaining Oysters • Larvae • Seed • Spat-on-Shell • Stage 2: Final Product • Half-Shell • Shucked Oyster • Stage 3: Selling Method • Wholesale • Direct Sell Design Alternatives
Oyster Lifecycle Larvae Seed Data Source = Maryland Sea Grant, 2011 Spat-on-Shell Design Alternatives
Stage 1: Obtaining Oysters Larvae • Growth Method • -Remote Setting • Type of Cultch • -Recycled Full Shell • Number of Oysters on Each Shell • -Multiple Data Source = Abel, 2011 Design Alternatives
Stage 1: Obtaining Oysters Seed • Growth Method • -Nursery • Type of Cultch • -Finely Crushed Shell • Number of Oysters on Each Shell • -One Data Source = Shockley, 2011 Design Alternatives
Stage 1: Obtaining Oysters Spat-On-Shell • Growth Method • -N/A (Ready to be Placed in Cages) • Type of Cultch • -Full Shell • Number of Oysters on Each Shell • -One Data Source = Congrove, 2009 Design Alternatives
Stages 2 & 3 Final Product Selling Method Direct Sale Requires a large investment of time and energy by the seller One-on-one demonstrations Personal contact Internet sales Wholesale Selling the oysters in large quantities to be retailed by certified dealers Requires less investment of time and energy by the producer • Shucked Oyster • Ability to reuse shell • Can be sold for canning • Half Shell • Can be sold to restaurants • Only one oyster per shell • Can typically be sold for more • Not able to reuse shell (Kallen, 2001) (MDNR,2011) Design Alternatives
Design Question: Cage Assemblies Longline Culture System B A C • 3 subsystems: • Mooring-Anchor System (A) • Floatation System (B) • Growing System (C) (Merino, 1997) Design Questions
Example of Floating Cages (Webster, 2007) Design Questions
Cage Assemblies FTension FTension FBuoyancy FTension FTension mg Buoyancy mg FTension FTension Design Questions
Agenda • Context Analysis • Problem Statement • Stakeholder Analysis • Statement of Need • Design Alternatives/Questions • Method of Analysis/Simulation • Project Plan/Budget
Method of Analysis Larvae 2DTMM Growth Model Utility Function Cost/Benefit Analysis Seed Business Model Spat on Shell Alternatives Simulation Analysis Timeline 2DTMM = Two Dimensional Tidal Mixing Model (From Previous Project) Method of Analysis
Growth Model Stochastic Variable Mortality? Environmental Variables Stochastic Variable Oyster Biomass Biometric Variables Growth Rate Oyster Biomass Initial Conditions Final Output Method of Analysis
Environmental Variables Biometric Variables Source: C. Cerco/M. Noel 2007 [5] [19] Method of Analysis
Oyster Biomass • Total weight of oysters measured in kg Carbon • ΔO = (α * Fr * POC * IF(1-RF) * O) – (BM * O – β * O) • GROWTHDEATH Source: C. Cerco/M. Noel 2007 [5] [19] Method of Analysis
Growth Model Assumptions • The water column being modeled is thoroughly mixed. • Sink amounts will be placed within legal boundaries. • Sink rates will be uniform for the entire cell. • Wind shear will be negligible. • Tide flow into each cell occurs instantaneously. • Environmental variable concentrations are assumed to be uniform throughout each cell. Method of Analysis
Growth Model Validation • Method A – Scenario Simulation • Compare model filtration rate with real oyster filtration rate within different scenarios. • Ex. Compare a 3 year cycle of oyster growth to fully grown oysters and measure filtration • Method B – Pilot Study • Funded by SERC • Measure Oyster Growth for a year, verify with model. Method of Analysis
Notional Oyster Growth Simulation
2D Tidal Mixing Model OysterBiomass Cell 1 Cell 2 Cell 3 Tidal Flow Cell 6 Cell 5 Cell 4 Cell Attributes Cell 8 Cell 9 Cell 7 N,P,TSS Load Initial Conditions N,P,TSS Removed Final Output Method of Analysis
Cell Attributes Source: J. Askvig et al. 2011 [1] Method of Analysis
Tidal Flow Vn= Volume of Cell n F = River volume Tn= Tide volume of Cell n Bn = Bay Concentration of Nitrogen Nn= Nitrogen concentration of Cell n Rn = River Concentration of Nitrogen Bay to Cell 1: N1= (N1·V1+ Bn·T1) / (V1+T1) V1 Cell 1 to Cell 2: N2= (N2·V2+ N1·T2) / (V2+T2) N1= (N1· (V1+ T1 ) + Bn·T1 - N1·T2) / (V1+T1) Ve Cell 2 to Cell 3: N3= (N3·V3+ N2·T3) / (V3+T3) V0 N2= (N2· (V2+ T2 ) + N1·T3 - N2·T3) / (V2+T2) N1= (N1· (V1+ T1 ) + Bn·T3 - N1·T3) / (V1+T1) Cell 3 to Cell 4: N4= (N4·V4+ N3·T4) / (V4+T4) N3= (N3· (V3+ T3 ) + N3·T4 - N3·T4) / (V3+T3) V0+Ve+Vt1 = V2Assume complete mixing and a new N2 mg/L N2= (N2· (V2+ T2 ) + N1·T3 - N2·T4) / (V2+T2) Source: VIMS, 1993 Method of Analysis
Oyster Clearance Rates • Filtration Rate (FR) = Frmax*F(S)*F(DO)*F(T)*F(TSS) • Frmax = 0.55 m³ g • F(S) = 0.5*(1 + tanh(S – 7.5)) • F(DO) = (1+exp(3.67*(1-DO))) • F(T) = exp(-0.015*(T – 27)²) • F(TSS) = 0.1 when TSS < 5 mg/L 1.0 when 5 mg/L < TSS < 25 mg/L 0.2 when 25 mg/L < TSS < 100 mg/L 0.1 when TSS > 100 mg/L Method of Analysis
Future Growth Simulation Work • 4.2.4 Build Growth Simulation • 4.2.6 Validate Model • 4.2.7 Run Monte Carlo Simulation • 5.2 Analyze Model • Assess Survivability Probability • Verify Model Growth Rate • 5.2.1 Conduct Sensitivity Analysis • Environmental Variable Analysis Method of Analysis
Business Model t < 5 Yrs Start-up Cost/ Loan Payment Survival? Time Yes t > 5 Yrs t < 3 Yrs + No Time End I Cost Growth Model No Profit? Yes t >= 3 Yrs Revenue Plant oysters for next season t + 1 Method of Analysis
Business Model Variables Method of Analysis
Business Model Assumptions • Certain equipment will need to be replaced on 3,5, and 10 year basis • Receive MDNR loan • 5 year loan • Interest only first 3 years (3% yearly) • 40% forgiven beginning of fourth year if in good standing with MDNR • Last 2 years principle payments with 5% yearly interest Method of Analysis
Design of Experiment Method of Analysis