1 / 1

Figure 1 The relationship between sodium status and adverse event rates during RAAS blockade

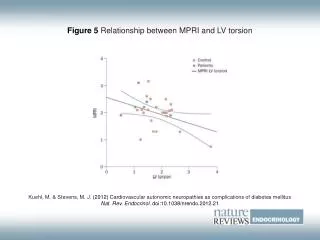
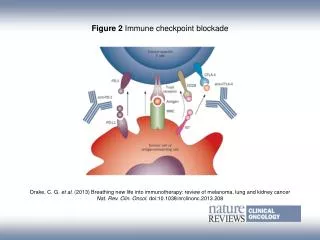
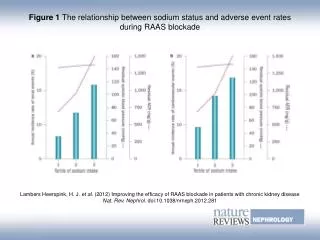
Figure 1 The relationship between sodium status and adverse event rates during RAAS blockade. Lambers Heerspink, H. J. et al . (2012) Improving the efficacy of RAAS blockade in patients with chronic kidney disease Nat. Rev. Nephrol. doi:10.1038/nrneph.2012.281.

dai
Télécharger la présentation

Figure 1 The relationship between sodium status and adverse event rates during RAAS blockade

An Image/Link below is provided (as is) to download presentation Download Policy: Content on the Website is provided to you AS IS for your information and personal use and may not be sold / licensed / shared on other websites without getting consent from its author. Content is provided to you AS IS for your information and personal use only. Download presentation by click this link. While downloading, if for some reason you are not able to download a presentation, the publisher may have deleted the file from their server. During download, if you can't get a presentation, the file might be deleted by the publisher.

E N D

Presentation Transcript


  1. Figure 1The relationship between sodium status and adverse event rates during RAAS blockade Lambers Heerspink, H. J. et al. (2012) Improving the efficacy of RAAS blockade in patients with chronic kidney disease Nat. Rev. Nephrol. doi:10.1038/nrneph.2012.281

More Related