Download
1 / 25
250 likes | 437 Vues
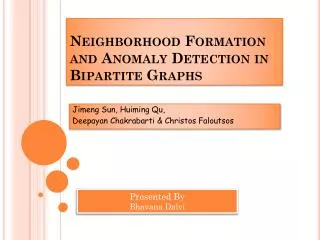
Jimeng Sun Huiming Qu Deepayan Chakrabarti Christos Faloutsos . Neighborhood Formation and Anomaly Detection in Bipartite Graphs. Speaker: Jimeng Sun. Bipartite Graphs. G={ V 1 + V 2 , E} such that edges are between V 1 and V 2

E N D
Jimeng Sun Huiming Qu Deepayan ChakrabartiChristos Faloutsos Neighborhood Formation and Anomaly Detection in Bipartite Graphs Speaker: Jimeng Sun
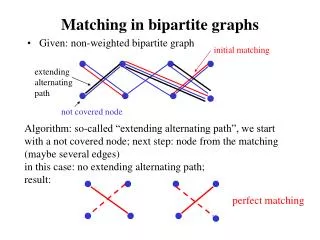
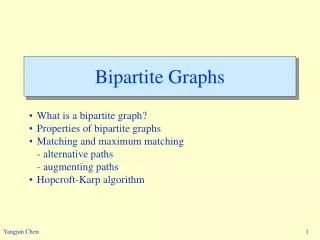
Bipartite Graphs • G={V1 +V2, E} such that edges are between V1 and V2 • Many applications can be modeled using bipartite graphs • The key is to utilize these links across two natural groups for data mining
.3 .25 .2 .25 .05 .05 .01 .002 .01 Problem Definition • Neighborhood formation (NF) • Given a query node a in V1, what are the relevance scores of all the nodes in V1 to a ? • Anomaly detection (AD) • Given a query node a in V1, what are the normality scores for nodes in V2 that link to a ? V1 V2 a
Application I: Publication network • Authors vs. papers in research communities • Interesting queries: • Which authors are most related to Dr. Carman? • Which is the most unusual paper written by Dr. Carman?
Application II: P2P network • Users vs. files in P2P systems • Interesting queries: • Find the users with similar preferences to me • Locate files that are downloaded by users with very different preferences users files
Application III: Financial Trading • Traders vs. stocks in stock markets • Interesting queries: • Which are the most similar stocks to company A? • Find most unusual traders (i.e., cross sectors)
Application IV: Collaborative filtering • collaborative filtering • recommendation system Customers Products
Outline • Problem Definition • Motivation • Neighborhood formation • Anomaly detection • Experiments • Related work • Conclusion and future work
Outline • Problem Definition • Motivation • Neighborhood formation • Anomaly detection • Experiments • Related work • Conclusion and future work
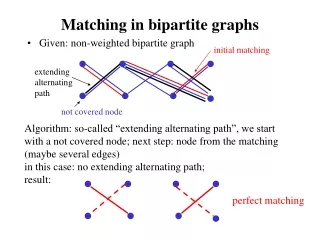
.3 .2 .05 .01 .002 .01 Neighborhood formation – intuition Input: a graph G and a query node q Output: relevance scores to q • random-walk with restart from q in V1 • record the probability visiting each node in V1 • the nodes with higher probability are the neighbors V1 V2 q
c c q c c c Exact neighborhood formation Input: a graph G and a query node q Output: relevance scores to q • Construct the transition matrix P where • every node in the graph becomes a state • every state has a restart probability c to jump back to the query node q. • transition probability • Find the steady-state probability u which is the relevance score of all the nodes to q (1-c)
Approximate neighborhood formation • Scalability problem with exact neighborhood formation: • too expensive to do for every single node in V1 • Observation: • Nodes that are far away from q have almost 0 relevance scores. • Idea: • Partition the graphs and apply neighborhood formation for the partition containing q.
Outline • Problem Definition • Motivation • Neighborhood formation • Anomaly detection • Experiments • Related work • Conclusion and future work
Anomaly detection - intuition • t in V2 is normal if all a in V1 that link to t belong to the same neighborhood • e.g. t t high normality low normality
Anomaly detection - method Input: a query node q from V2 Output: the normality score of q • Find the set of nodes connected to q, say S • Compute relevance scores of elements in S, denoted as rs • Apply score function f(rs) to obtain normality scores: • e.g. f(rs) = mean(rs) S q
Outline • Problem Definition • Motivation • Neighborhood formation • Anomaly detection • Experiments • Related work • Conclusion and future work
Goals [Q1]: Do the neighborhoods make sense? (NF) [Q2]: How accurateis the approximate NF? [Q3]: Do the anomalies make sense? (AD) [Q4]: What about the computational cost?
relevance score most relevant neighbors [Q1] Exact NF Robert DeNiro (IMDB) ICDM (CA) • The nodes (x-axis) with the highest relevance scores (y-axis) are indeed very relevant to the query node. • The relevance scores can quantify how close/related the node is to the query node. relevance score most relevant neighbors
[Q2] Approximate NF • Precision = fraction of overlaps between ApprNF and NF among top k neighbors • The precision drops slowly while increasing the number of partition • The precision remain high for a wide range of neighborhood size neighborhood size = 20 num of partitions = 10 Precision Precision # of partitions neighborhood size
[Q3] Anomaly detection • Randomly inject some nodes and edges (biased towards high-degree nodes) • The genuine ones on average have high normality score than the injected ones normality score
[Q4] Computational cost • Even with a small number of partitions, the computational cost can be reduced dramatically. Approximate NF Time(sec) # of Partitions
Related Work • Random walk [Brin & Page98] [Haveliwala WWW02] • Graph partitioning [Karypis and Kumar98] [Kannan et al. FOCS00] • Collaborative filtering [Shardanand&Maes95] … • Anomaly detection [Aggarwal&Yu. SIMOD01] [Noble&Cook KDD03][Newman03]
Conclusion • Two important queries on bipartite graphs: NF and AD • An efficient method for NF using random-walk with restart and graph partitioning techniques • Based the result of NF, we can also spot anomalies (AD) • Effectiveness is confirmed on real datasets
Future work and Q & A • Future work • What about time-evolving graphs? • Contact: Jimeng Sun jimeng@cs.cmu.edu http://www.cs.cmu.edu/~jimeng