Download
1 / 13
130 likes | 300 Vues
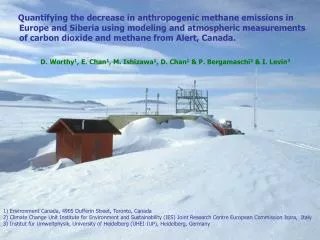
Quantifying the decrease in anthropogenic methane emissions in Europe and Siberia using modeling and atmospheric measurements of carbon dioxide and methane from Alert, Canada. D. Worthy 1 , E. Chan 1 , M. Ishizawa 1 , D. Chan 1 & P. Bergamaschi 2 & I. Levin 3.

E N D
Quantifying the decrease in anthropogenic methane emissions in Europe and Siberia using modeling and atmospheric measurements of carbon dioxide and methane from Alert, Canada. D. Worthy1, E. Chan1, M. Ishizawa1, D. Chan1 & P. Bergamaschi2 & I. Levin3 1) Environment Canada, 4905 Dufferin Street, Toronto, Canada 2) Climate Change Unit Institute for Environment and Sustainability (IES) Joint Research Centre European Commission Ispra, Italy 3) Institut für Umweltphysik, University of Heidelberg (UHEI-IUP), Heidelberg, Germany
Canada’s GHG Air Sampling Network In situ and flask CO, CO2, CH4, N2O, SF6; Flask H2,and CO2 isotopes Flask CO, CO2, CH4, N2O, H2, SF6 & CO2 isotopes only (Estevan Point) Proposed CCP and IPY sites Aircraft vertical profiles (NOAA) Alert CO2 Dr. Neil Trivett Global Atmosphere Watch Observatory Alert CH4
Alert CH4 - Dec-Feb 1988 - 2004 25 Day Time Series Alert CO2 - Dec-Feb 1988 - 2004
Ratio of CH4 to CO2 (Long-term trend & seasonality removed) 1989/1990 1997/1998
Model Simulations (9 regions and 11 emission sources) P. Bergamaschi et al. (2006: Satellite cartography of atmospheric methane by extending the CH4 dataset retrieved from SCIAMACHY & inverse model simulations for 2003 (using NOAA flask CH4 measurements & TM5 transport model).
Atmospheric CH4 at Alert is simulated using the NIES atmospheric transport model and NCEP reanalysis meteorology
In situ/model CH4 comparison Jan. 1 to Feb. 6 1991 Relative CH4 contribution by region
Western Siberia Europe Temperate Asia
Modeled CH4/CO2 comparison Western Siberian CH4 source change of 3.4 Tg/yrchanges the ratio by 1 ppb/ppm If change occurs only in Western Siberia this would result in a 14 Tg/yr source change European CH4 source change of8.36 Tg/yr changes the ratio by 1 ppb/ppm If change occurs only in Europe this would result in a 33 Tg/yr source change
Change in anthropogenic CH4 emissions:1990-2000 (source: EDGAR) [M*kg/grid]
Change in anthropogenic CH4 emissions1990-2000 (source: EDGAR) Europe (-14 Tg/yr) Energy : -8.1 Animal : -5.3 Waste : -0.5 W. Siberia (-2 Tg/yr) Energy : -1.6 Animal : -0.5 Waste : 0.02 E. Siberia (-0.08 Tg/yr) Energy : -0.12 Animal : 0.02 Waste : 0.02 [M*kg/grid]
Summary : The time series of CH4/CO2 ratios at Alert observatory during well-defined episodes primarily originating from Siberian and/or European source regions dropped by ~ 40% from 1988 to 2005. Time series of modelled CH4/CO2 ratios (using the NIES atmospheric transport model and NCEP reanalysis meteorology, along with annual reported CO2 sources and individual CH4sources for 2003) showed no change over the same time period. Partitioning the simulated CH4events into contributions by region showed that on average, fossil fuel emissions from Europe accounted for more than 50% of the signal with Western Siberia having the 2nd largest contribution To reproduce the trend in the ratio of CH4/CO2observed in the data requires a reduction in emissions of CH4on the order of 14 to 33 Tg/yr, depending on the regions contributing to this decrease. If the EDGAR emissions changes for Europe of 14 Tg/yr are correct our analysis suggests a emissions change for Western Siberia of 7 Tg/yr. If the Bousquet et al. estimate (see Poster) of emissions changes for Europe of about 30 Tg/yr is correct our data would agree and Edgar would be wrong by a factor of two Study is still on-going.