Assessing High-Impact Weather Variations and Changes Utilizing Extreme Value Theory
300 likes | 490 Vues
Assessing High-Impact Weather Variations and Changes Utilizing Extreme Value Theory . Greg Holland. NCAR Earth System Laboratory National Center for Atmospheric Research Boulder, Co, USA. NCAR is Sponsored by NSF and this work is partially supported by the

Assessing High-Impact Weather Variations and Changes Utilizing Extreme Value Theory
E N D
Presentation Transcript
Assessing High-Impact Weather Variations and Changes Utilizing Extreme Value Theory Greg Holland NCAR Earth System Laboratory National Center for Atmospheric Research Boulder, Co, USA NCAR is Sponsored by NSF and this work is partially supported by the Willis Research Network and the Research Program to Secure Energy for America
Presentation Summary • The Issues • Applying Extreme Value Theory • Reverse Weibull and Generalized Pareto Examples for Hurricanes • Current and Future Climate • Example Application • Other Studies • Suggest that Extreme Weather provides a Bellwether of Climate Transition and Change Holland ASP Extremes Colloquium 0611
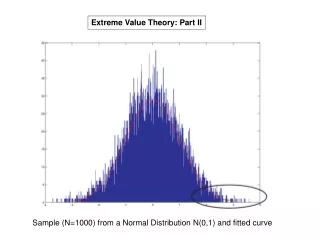
The Issues Highly skewed Short and noisy record • May be truncated at high values: • Real physical limitation • Resolution/capacity/rarity Frequency • May be truncated at low values: • Observing practice • High noise level Societal Importance α rarity Value Typical weather-system PDF Holland ASP Extremes Colloquium 0611
Early Applications of EVT • Mearns, L. O., Katz, R. W., and Schneider, S. H., 1984: Extreme High-Temperature Events: Changes in their Probabilities with Changes in Mean Temperature. J. Clim. Appl. Meteorol. 23, 1601-1613. • Katz, R. and B. Brown, 1992: Extreme Events in a Changing Climate: Variability is more Important than Averages. Clim. Change.,21, 289-302. • Katz, R. and B. Brown, 1994: Sensitivity of Extreme Events to Climate Change: The Case of Autocorrelated Time Series. Environmetrics, 5, 451-462. Holland ASP Extremes Colloquium 0611
Our Current Applications of EVT • Helping assess data reliability for meteorological extremes; • Downscaling to build up an assessment of the tail of the severe weather distribution utilizing the truncated information that comes out of regional climate models; • Enabling recognition and understanding of potential “regime” shifts in climate series; • Assessing the “uniqueness” of specific extreme events, or combinations thereof, in the context of current and changing climate. Holland ASP Extremes Colloquium 0611
Choice of Distribution For working with just the tail of the distribution, the Generalized Pareto might be more appropriate. Frequency • Fisher-Tippett (-Gnedenko) Theorem (FTT) for Extreme Value Theory states that the normalized maximum of any set of random variables can be explained by one of three distributions: • Weibull (Weibull 1939) • Gumbel (Gumbel 1958) or • Fréchet, (Fréchet 1927) • (also known as Type 1, 2 or 3: Fisher and Tippett 1928, Gnedenko 1948). Value Holland ASP Extremes Colloquium 0611
Example Application: Hurricanes Annual Frequency Intensity Holland ASP Extremes Colloquium 0611
Weibull Analysis We utilize the Reverse Weibull distribution for which the CDF and PDF are: • Where: • parameters a and b determine the scale and the shape, respectively • b=1 is the exponential distribution • b=2 is the Rayleigh distribution, and • b=3.5 is an approximation of the normal distribution. Holland ASP Extremes Colloquium 0611
Sensitivity to Scale and Shape Variations Holland ASP Extremes Colloquium 0611
Sensitivity to Scale and Shape Variations Hazard Rate Function for the Weibull distribution: (Hillier and Lieberman 1986) Frequency For b>1 the sensitivity increases with increasing x to a limit of 1-e-x . (Katz and Brown 1994) Value Holland ASP Extremes Colloquium 0611
Weibull Analysis Probability of exceeding a threshold event: Exceedance probability decreases as the event becomes rarer (c/a increases), and/or the population less variable (b increases). Holland ASP Extremes Colloquium 0611
Weibull Analysis (where: Γ is the Gamma function) • Γ(n) α (n-1)! • Given µ and σ we can make an estimate of a and b and thus the whole distribution. Holland ASP Extremes Colloquium 0611
Application to Atlantic Hurricane Intensity Intensity PDF Log-Log Weibull Probability Plot PDF (Normalized, HURDAT Smoothed) CDF with Weibull fit: a=35, b=1.9 Holland ASP Extremes Colloquium 0611
Application to Current Climate:1980-1994 vs 1994-2007 • Mean intensity and SD change of 2-3 and 4-5 m/s • 3-5 times increase in probability of Cat 5 hurricanes! • Equivalent to moving from 1 Cat 5 every 3-5 years to 1 every year. • (Caveat on ability to fit the observed distribution) Holland ASP Extremes Colloquium 0611
Application to Current Climate Intensity PDF Annual Frequency PDF Weibull original is for 1980-1994 data Observed is 1995-2008 data (Data from IBTrACS) Holland ASP Extremes Colloquium 0611
Application to Truncated Model PDFs The Issue: Regional Climate Models cannot run over long time scales at resolutions sufficient to resolve weather extremes Holland ASP Extremes Colloquium 0611
Background: Regional Climate Modeling 12 km 36 km 150 km Time Slices Holland ASP Extremes Colloquium 0611
NRCM Hurricane Intensity Change Model projected increase in TC intensity, but can only resolve up to Cat 2. How do we assess the extremes? Wind speed distribution shifting to right Cannot use EVT extrapolation or quantile mapping Holland ASP Extremes Colloquium 0611
Application to Model Data • We make the following assumptions: • the modeled changes are indicative of the changes that would have been simulated in the full distribution, were it resolved • there is no process that will cause a change in the unresolved tail of the distribution without any signal in the resolved component. • Note: the truncated model will underestimate changes in mean and SD • Thus this approach provides a conservative assessment. Holland ASP Extremes Colloquium 0611
Method • Fit a Reflected Weibull to the observed distribution for a specified historical period and calculate the exceedanceprobability for the extremes of interest • Calculate the mean and standard deviation changes from current to future climate model predictions; • Apply these changes to assess the changes to the Reflected Weibull shape and strength parameters; • Apply these new parameters to fill out an estimated distribution and to calculate changes in exceedanceprobability. Holland ASP Extremes Colloquium 0611
Example: NRCM Hurricane Changes Holland ASP Extremes Colloquium 0611
Application to NRCM Hurricane Predictions PE69=Cat5 PE58=Cat4,5 PE48=Major Hurricanes PE32=Hurricanes Holland ASP Extremes Colloquium 0611
Alternative Generalized Pareto Distribution (where a,b,c are the scale, shape and location parameters) • Results: • Exceedance probability decreases for weak storms • Exceedance probability increases for intense storms • Cat 5 by 29% for 2045-2055 compared to 32% for Weibull (Suzuki 2011) Holland ASP Extremes Colloquium 0611
Comparison with Alternative Approaches Holland ASP Extremes Colloquium 0611
Bender et al (2009) • Used GFDL Hurricane Model applied to future storms: • Mean intensity increase ~2.5 m/s • 78% increase in Cat4-5 numbers • Applying EVT to 1995-2007 conditions (same period as Bender et al): • Mean intensity increase of 2.5 m/s gives ~35% increase in Cat4-5; • Adding increase in SD of 5 m/s gives ~60% increase in Cat4-5. Holland ASP Extremes Colloquium 0611
Yamada et al 2010 Cloud-resolving simulation over limited time period, with and without Greenhouse Warming contribution. Holland ASP Extremes Colloquium 0611
Hallegatte et al (2007) Annual probability of landfall increase: Cat1=17% , Cat2=33%, Cat3=44%, Cat 4=58%, and Cat5=215%. Holland ASP Extremes Colloquium 0611
Hallegatte et al ctd • The nonlinearity of intense hurricane changes is a clear illustration of the multiplicative effect of extreme events: • “a limited change in the characteristics of the mean (+13% in average maximum wind speed at landfall) can have a dramatic impact on the distribution tail (+215% increase in category-5 landfall probability)”. • Moreover, because socio-economic impacts of hurricanes are highly nonlinear with respect to hurricane intensity, such an evolution may translate into an even larger change for hurricane damages Holland ASP Extremes Colloquium 0611
Severe Weather as a Bellwether of Climate Transition and Change • This analysis indicates that: • Weather extremes will respond to climate variability and change at much higher amplitude than will the general weather-system population • Thus, weather extremes provide a bellwether of climate transition and change Holland ASP Extremes Colloquium 0611
Summary • Application of EVT to weather extremes can provide a valuable tool for: • diagnosing extremes • assessing potential signals for climate variability and change • downscaling assessment for any weather extreme • EVT predicts that changes in extremes will be >>> than those in the mean or variance: • extreme hurricanes increase 2-3-fold for a 5-10% increase in the mean and SD • supported by both observations and modeling • Implies climate variability and change will first appear in extremes, thus • Weather extremes may provide a bellwether for climate variability and change Thank You Holland ASP Extremes Colloquium 0611