Stress testing and Extreme Value Theory
Stress testing and Extreme Value Theory. By A V Vedpuriswar. September 12, 2009. Introduction. If a bank uses a 99% confidence level to calculate its value at risk, it generally expects to suffer a loss exceeding the value at risk on one day out of every 100.

Stress testing and Extreme Value Theory
E N D
Presentation Transcript
Stress testing and Extreme Value Theory By A V Vedpuriswar September 12, 2009
Introduction • If a bank uses a 99% confidence level to calculate its value at risk, it generally expects to suffer a loss exceeding the value at risk on one day out of every 100. • What happens, however, on the one day when the value at risk is exceeded? • How large is the loss on this day? • Could this be the one bad day required to break the bank? • Such possibilities are considered under stress testing. • Stress testing refers to techniques used by financial institutions to analyze the effects of exceptional but plausible events in the market on a portfolio's value.
Usefulness of stress tests • Stress tests help financial institutions to: • overcome the shortfall of VAR models (as they deal with tail events neglected by many such models) • communicate extreme scenarios throughout the institution, thereby enabling management to take the necessary precautions (limit systems, additional capital, and so on) • manage risk better in more volatile and less liquid markets • bear in mind, during less volatile periods, that the probability of disastrous events occurring should not be neglected
Single-Factor Stress Testing • Sometimes referred to as sensitivity testing • Single-factor stress testing involves applying a shift to a specific risk factor affecting a portfolio . • Risk factors commonly used in sensitivity testing include changes in • interest rates, • equity prices and • exchange rates.
Standardised single factor shocks • Standardised single-factor shocks have been issued by several organizations, the most prominent of which is probably the Derivatives Policy Group (DPG). • The standardized movements in the risk factors suggested by the DPG include: • A parallel shift in the yield curve of 100 basis points up and down • Yield curve steepening/flattening by 25 basis points • Stock index changes of 10% up and down • Movements of 6% up and down in major currencies (20% for other currencies) relative to the US dollar
Subjective Shocks • Rather then use standardized changes in the risk factors, many banks choose to run sensitivity tests based on their own subjective opinion of a relevant risk factor shock and its magnitude. • As this is an entirely subjective approach, it depends critically on the ability of individual risk managers to choose risk factor shocks and magnitudes that are both plausible and relevant to their portfolio.
Multiple factor stress testing • Many financial institutions run stress test scenarios in addition to sensitivity tests. • Scenario analysis involves applying simultaneous moves in multiple risk factors such as interest rates, exchange rates and stock prices, to a portfolio.
Historical and hypothetical scenarios • Historical scenario testing involves revaluing a portfolio using values for the risk factors that existed during historical stress events. • Hypothetical scenarios can be used when: • no historical stress event is suitable for the portfolio in question • risk managers want to stress test new or different combinations of risk factors • hypothetical scenarios can be created by imagining extreme, but plausible, events that have not yet happened. • Such scenarios may build upon, or expand, historical scenarios
One of the most popular methods of creating hypothetical scenarios is to combine worst-case movements in the risk factors. • Unfortunately, the worst-case scenario method can also create implausible scenarios as it ignores any correlation between the different risk factors. • It is more useful to construct scenarios that reflect the combined effects of multiple risk factors and therefore incorporate possible correlation among the risk factors in times of stress.
Conducting stress tests • Once a set of scenarios has been developed, the next step is to analyze the effect of each scenario on the value of the portfolio. • This can sometimes be done in the same way as a simulation to calculate VAR. • Stress tests can be run by inputting the stressed values of the risk factors into VAR models and recalculating the portfolio value using the new data.
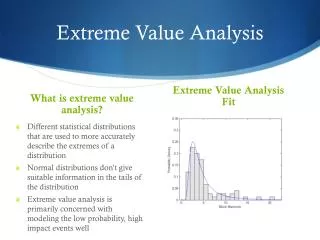
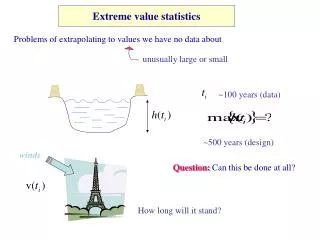
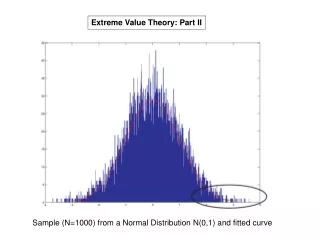
Extreme Value Theory • Extreme value theory (EVT) is a branch of statistics dealing with extreme deviations from the mean of statistical distributions. • In other words, it is the study of the tails of distributions. • Focus on extreme tail behavior is important because it has been shown that actual return distributions display a higher probability for extreme events (fat tails).
Extreme Value Theorem • The key aspect of EVT is the extreme value theorem. • Given certain conditions, the distribution of extreme returns in large samples converges to a particular known form, whatever the initial or parent distribution of the returns. • The theorem tells us what the distribution of extreme values should look like in the limit, as the sample size increases. • This distribution is characterized by three parameters: • location (corresponds to the mean) • scale (corresponds to the standard deviation) • shape (or tail)
The tail parameter (or tail index) defines the specific distribution to be used and is the most important as it gives an indication of the heaviness or fatness of the tails of the distribution.
Extreme Value Distributions • Suppose we have a sample of return observations from some unknown distribution. • Then, using extreme value theory, we can say that for a large class of underlying distributions, the distribution of excess returns x converges to a Generalized Pareto distribution (GPD) as the threshold u is progressively raised. • A GPD is a distribution that models the excess losses above a threshold:
How Useful is EVT? • Parametric VAR models work by fitting a certain distribution (usually normal) to observed return data. • However, because most observations lie close to the center of any empirical distribution, these approaches tend to fit curves that accommodate these central observations. • For the purposes of VAR, however, it is the observations in the tail of a distribution that are the most important. • The EV approach, on the other hand, is specifically designed for tail behavior and is therefore free of these problems. • The EV approach to value at risk calculation is very useful because it does not make very strong assumptions about the shape of this unknown distribution.