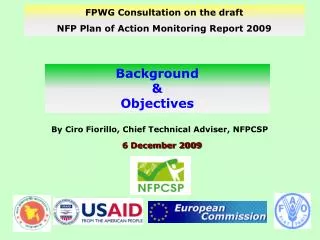
6 December 2009
90 likes | 250 Vues
NFP Objective 2 Increased purchasing power and access to food of the people. Overview of Progress and Policy challenges. FPWG Consultation on the draft NFP Plan of Action Monitoring Report 2009. 6 December 2009. Selected performance indicators. 1. Assessment.

6 December 2009
E N D
Presentation Transcript
NFP Objective 2 Increased purchasing power and access to food of the people Overview of Progress and Policy challenges FPWG Consultation on the draft NFP Plan of Action Monitoring Report 2009 6 December 2009
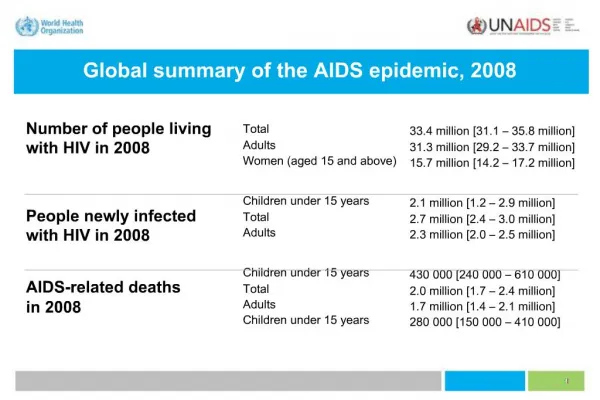
1. Assessment • Proportion of undernourished (%) • From 36% baselinein 1990-92 to 40% in 1995-97 and 26% in 2004-06 • Aim: 18% by 2015 (FAO) • Number of undernourished in million • From 41.6 baselinein 1990-92 to 51.4 in 1995-97 and 40.2 in 2004-06 • Aim: 20 by 2015 (FAO) • CBN poverty rate • Upper poverty line: significant decrease from 50% in 1995-96 to 40% in 2005 • Lower poverty line: from 35% to 25% over the same period (BBS) • Rural-urban gap narrowed but rural poverty rate in 2005 still more than 1.5 times urban rate • Incomepoverty (CBN) reduction has been faster than food insecurity reduction (DCI) in rural areas => less scope for consumptionof own produce in cities
1. Assessment (Cont.) • Number offood insecureincreased by about 2 million between 2000 and 2005 • 2005: 56 million living on less than 2,122 kcal/day/per capita • 41.2 million of them in rural areas • Income inequality increased (Gini coefficient from 0.31 in 2000 to 0.53 in 2008), esp. in rural areas (from 0.27 in 2000 to 0.49 in 2008) • Inequality compounded by regional disparities in poverty rates notably East and West. • Coastal districts and monga/drought prone areas also among poorest
1. Assessment (Cont.) Changes in food/rice prices • From an all time low (less than 2%) at the beginning of the 2000s, inflation increased to 9.9% in 2007/08 • Food inflation rose from beginning FY09-10, reflecting a recent surge in domestic prices of essential commodities • Similar pattern for rice price inflation but with much larger magnitudes: from a 6.9% in July 2006 to a staggering 70.4% in January 2008 followed by downward spiraling to a negative 31.3% in October 2009
1. Assessment (Cont.) Will the MDG poverty and hunger reduction targets be achieved? • MDG Progress Report (2008) estimates the poverty rate at 37% in 2008 and projects that the poverty target (29%) can be reached by 2015, BUT • rate of poverty reductioninsufficient for reaching target in rural areas • West of the country foreseen to lag behind target HOWEVER:This does not account for the impacts of the 2007-2008 shocks and effects of unfolding economic crisis • World Bank (2009) estimates that depending on effects of the global recession on exports and remittances: • CBN-poverty rate will fall to 31% (against 33% had there been no crisis), under the worst case scenario • Recession may undermine poverty reduction prospects in the East given larger concentration of industries and remittances • Latest FAO SOFI (2009): number of undernourished increasedbetween 2003-05 and 2004-06 => World Food Summit target of halving the number of hungry by 2015 unlikely to be achieved
2. Issues and policy challenges • Speeding up broad-based income generation in rural areas • Agricultural sector contributes 20% of GDP and employs more than 70% of the population • Need to step up interventions to increase agricultural productivity in labor intensive/higher value crops with special focus on small and marginal farmers in order to exploit their positive effects on food availability and real wages • Efforts to improve marketing and agribusiness management systems and develop agricultural value chains also required
2. Issues and policy challenges • Expanding productive/income-generating safety nets • Use of upazila-based poverty maps to be systematized in design of programs • Unemployment seasonality patterns to be taken into account in implementation schedule of safety nets • Addressing the specific vulnerabilities of food market-dependent poor people and of coastal/disaster prone-areas • Need to investigate potential trade-offs that difficult living conditions and costs (housing, basic services and employment) generate in terms of food access and consumption to better adapt interventions to urban areas • Need to explore possibility of mainstreaming disaster-risk reduction and resilience-building in safety net program targeting in disaster prone areas