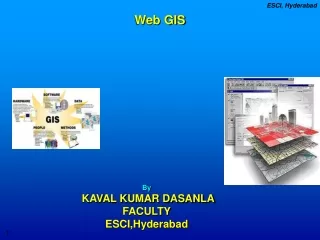
Web-Based GIS for Hydrological Impact Analysis
380 likes | 719 Vues
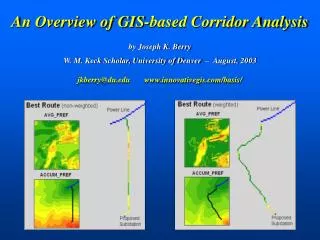
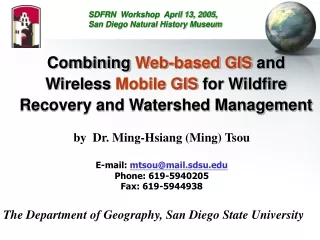
Web-Based GIS for Hydrological Impact Analysis. Bernie Engel, Professor and Head Larry Theller, GIS Specialist Agricultural and Biological Engineering Purdue University. Workshop Focus. This workshop gives an introduction to web-based GIS for Hydrological analysis.

Web-Based GIS for Hydrological Impact Analysis
E N D
Presentation Transcript
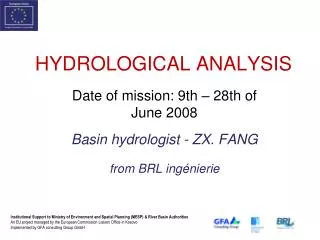
Web-Based GISfor Hydrological Impact Analysis Bernie Engel, Professor and Head Larry Theller, GIS Specialist Agricultural and Biological Engineering Purdue University
Workshop Focus This workshop gives an introduction to web-based GIS for Hydrological analysis. At the end of the workshop you would be able to access available watersheds, delineate these watersheds and change the land use within these watersheds. Several outputs are then available to assess the feasibility of the proposed changes. https://engineering.purdue.edu/~lthia/MSDSS/index.html
Assumptions • Water flows across the surface to form flowshed • no storm drains • Water equally spread across landscape • No routing • Average antecedent moisture • soil is not saturated or frozen • Rainfall is evenly spread in local area
Limitations • Accuracy of landuse and soil data • Big limitation • Accuracy of runoff curve number • Hydrological impacts are understated • LID not reflected • Accuracy of published NPS relationship • Lead in runoff based on 1990’s models
Curve Number Basics: rainfall to runoff ratio for different surfaces Direct Runoff Rainfall http://www.ecn.purdue.edu/runoff/documentation/scs.htm
Averaged mass of NPS contaminant from each landuse EMC Table
Take-Home points DEM is only used to calculate flowshed DEM is not used for erosion – or runoff Runoff is based on surface type – not slope won’t account for frozen ground 30 year average rainfall Chemistry is based on landuse averages
Databases provide input • Weather data (30 years of real rainfall) • Soil data (SSURGO ) or STATSGO • Elevation data 30m or 10m DEM (for contributing area)
L-THIA Example AnalysisFebruary 2010 Uses Wisconsin data. Discussion slides to follow the PDF: WQ Tools Workshop2.PDF Bernie Engel, Agricultural and Biological Engineering Purdue University https://engineering.purdue.edu/~lthia/MSDSS/WQToolsWorkshop.pdf
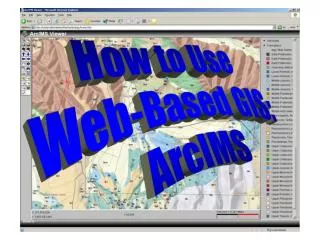
Online Watershed Delineation • Launch the webpage at:https://engineering.purdue.edu/~lthia/wi/ • Click on Wisconsin 10/30 meter • You should be at the Watershed Delineation Map Interface
Water layers are toggled on, watersheds are toggled off. Water is NHD High Resolution Streamlines Enter: Monches, WI and click Search button
High Impact Target layers from Michigan State Institute for Water Resources, and HUC layers from EPA streaming data services.
Water features show up over “satellite” images and in urban areas.
This is the development area This is a good delineation point. Click “delineate” button then click here.
Watershed (HUC8,10,12) info Pour Point (point clicked on) coordinates in local coordinate system. Landuse and soil breakdown for Watershed Area in acres of each unique landuse – hydrologic soil pair. Option to view this watershed over Google Maps. Choose this. Online models with data populated form this delineated area
Click pushpin to see toolbar. To edit landuse: Click tab: Digitize Then click link “Online Digitize”; Pour Point
Foreground Layers Background Layers Set the layers for edit session, then click here
Click “polygon” button and draw one with a final click on start point; then right-click inside to see pop-up menu for landuse selection. Last step is to click “Apply BMPs…”
Right-click inside new polygon to select landuse; and click toggle button to “Apply BMPs”
Tabular breakdown of area of all unique pairs of soil and landuse types. The L-THIA spreadsheet will be populated by these automatically. Online models with data populated from this delineated area.
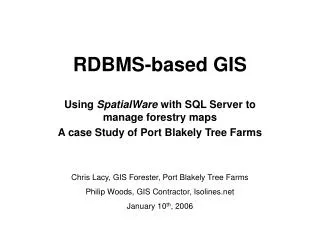
LTHIA Online tools • EPA Region 5 : L-THIA Hydrologic Impact Assessment Tool • https://engineering.purdue.edu/~lthia/ • Burns Ditch - Trail Creek • https://engineering.purdue.edu/mapserve/www/lthia_bdin/ • Swan Creek Management System Main page: http://35.9.116.206/swancreek/home.asp L-thia Page: https://engineering.purdue.edu/~lthia/swancreek/
Links below region 5 states go to Watershed Management Systems. These have BMPs added to the landuse tools.
Online Watershed Delineation • We will be using some tools to navigate in the map • At the top of the Map Interface locate the following four tools • Ignore the tools within the map area for the moment
Online Watershed Delineation • Click on the center of Logan County then click on the zoom in tool • Repeat the zoom in tool until Highways appear in the map (this should take two zoom ins) • Do two more zoom ins into the Logan County • Click on the “elbow” in the following Highway then click on pan • This centers the map at the “elbow”
LTHIA • Save drawing, then merge digitized land use with watershed map (buttons are at the bottom of page) • The land use before and after digitizing will be presented:
L-THIA Input Page After Changing Land Use Multiple scenarios – offer multiple development options. User constructs scenario by online digitizing.
LTHIA • Select the Run L-THIA button, this should take a few seconds • The L-THIA Output presents two scenarios (before and after land use change)