Download
1 / 8
80 likes | 209 Vues
Relation Between Consumer Confidence Index and other Macroeconomics indicators . ------using RBF approach. Sun Hao ( hsun9@wisc.edu ) Course: ECE539(2008~fall) Instructor: Pro.Yu Hen Hu. Background. ICS:

E N D
Relation Between Consumer Confidence Index and other Macroeconomics indicators ------using RBF approach Sun Hao (hsun9@wisc.edu) Course: ECE539(2008~fall) Instructor: Pro.Yu Hen Hu
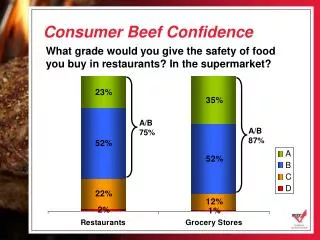
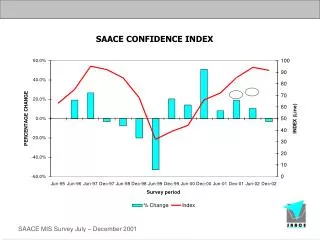
Background • ICS: • The Index of Consumer Sentiment (ICS) is a consumer confidence index published monthly by the university of Michigan. • Developed from national telephone interview • Other index • CPI: consumer price index; • UI: Initial claims for unemployment insurance; • DJI: Dow Jones Industrial Average Index;
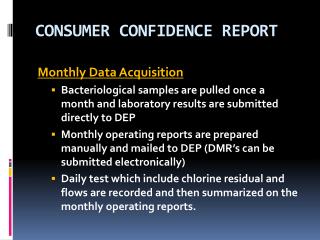
Data Preprocessing • Get data from website of federal reserve • Monthly data of: CPI, UI claim, DJI, ICS • Data range: Jan. 2005 to Oct. 2008 • Calculate the monthly change of these data
Construct model • Try different combination of input data. • Try monthly income, S&P 500, unemployment rate • Finally choose, CPI 1st,2nd change, UI,DJI, ICS • Try different configuration of network • Different spread of the radio basic function • Try MLP with back-propagation training • Compare with multivariable linear regression • Finally choose RBN
Testing Result Notes: 1.MSE: RBF: 67.54 MVLR: 69.22 2.Both of them can partly approximate the target curve 3.RBF perform slightly better.
Remaining Work Future job: • Improve the network and try other feather vector • Measure the effect of each input on the output.